“I’m not sure anyone believes you, it was a very cold month”, “My heating was on all month”. Just two examples of the replies to our statistics release that May 2024 was the warmest on record for UK mean temperature in a series dating back to 1884. In a month that was wet and dull for many, people certainly didn’t feel that May was a record breaking month. But what could cause such a disconnect between perception and statistical reality?
New analysis
In new analysis, Met Office scientists have looked at what caused such anomalously high temperatures for May, and the results go some way in explaining why people’s perceptions may not align.
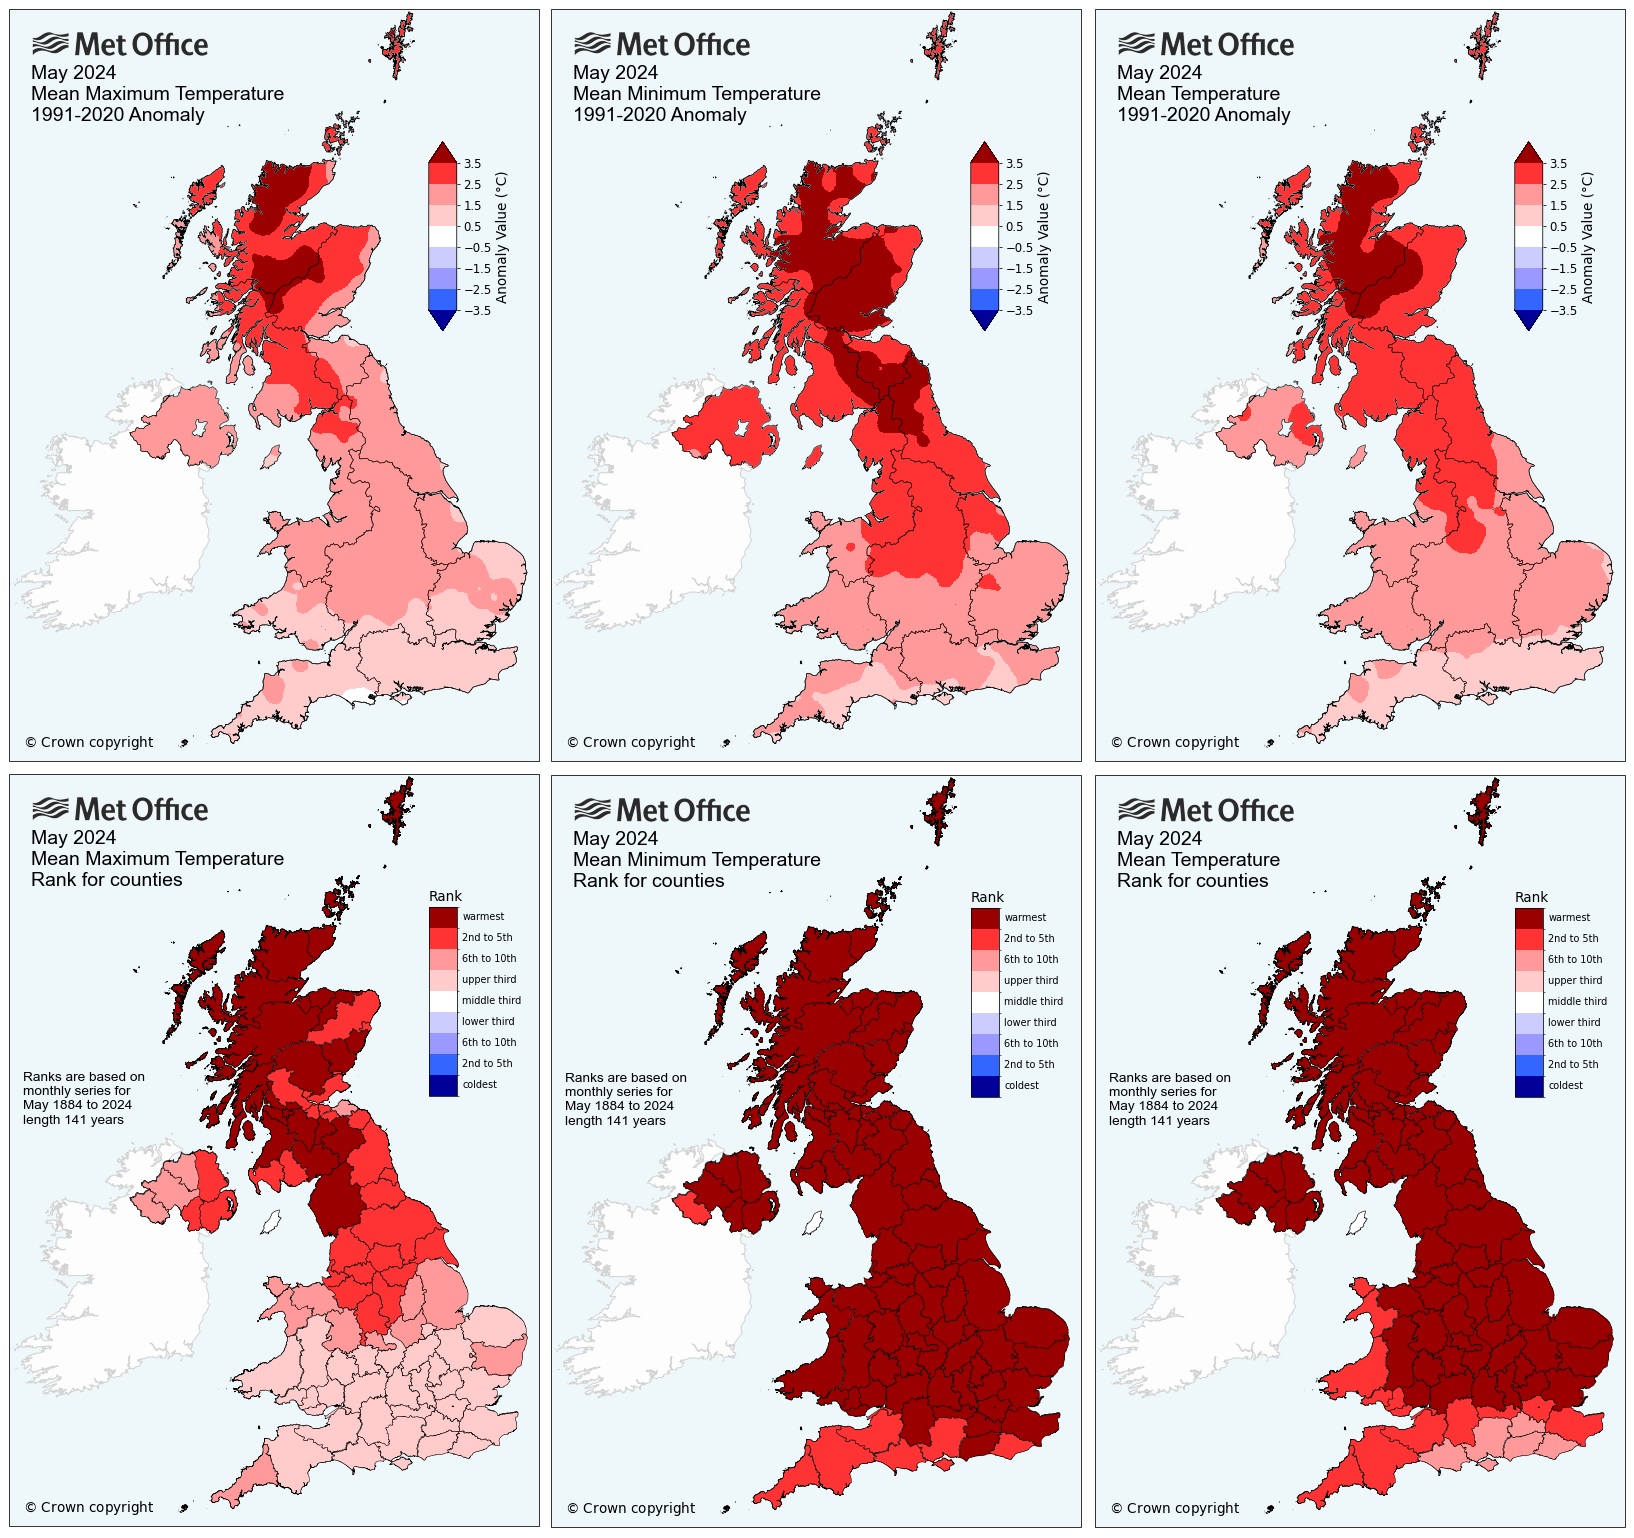
At first sight it was obvious that unusually high temperatures across Scotland and northern England had played a significant role in the overall monthly temperature figures. It was also clear that the mean minimum, or average overnight, temperatures were notably high and had influenced the mean monthly temperature as a whole. A large component of the higher than average temperatures were also in less densely populated parts of the UK.
The maps below illustrate this and show that the anomalies were high enough even down to southern England to set new records. The top row shows the temperature anomaly, the second row are May records by county, the dark red colour represents a record.
But what was driving these anomalous temperatures?

These maps clearly illustrate the extent and the magnitude of the anomalously high temperatures through May. Even though the highest anomalies were further north, records were broken all the way down to the south of England for mean and mean minimum temperature.
Using a new technique developed by Met Office scientists in response to the record-breaking UK mean air temperature and marine temperatures in June 2023, the team were able to examine the influence of a marine heatwave that was surrounding the UK through Spring and into June 2024.
What is a marine heatwave?
Marine heatwaves are defined as periods of at least 5-days exceeding the 90th percentile of sea surface temperature (SST), calculated from the first 30-years of the satellite observation period (1982-2012). They are then categorised on a scale of I (moderate) to IV (extreme) based on deviation from local climatology.
For the waters around the UK in May, the marine heatwave threshold is 11.3°C. The SSTs around the UK were nearly 1°C above this threshold in May 2024.
The SSTs in 2024 started warm, with an anomaly close to a category I marine heatwave, this warm anomaly persisted until the start of May, when it amplified and reached marine heatwave status. This marine heatwave lasted for the whole month of May and the first week of June. It peaked to category II on the week of 18th-24th May.
The map below shows its spatial extent for that week, showing it was affecting the whole of the shallow seas surrounding the UK, known as the Northwest European shelf (NWS), and reached category II in the Northern North Sea and the Celtic Sea, with +2.5-3.5°C locally.

Sea surface temperature anomaly for 18 – 25 May from 1982-2012 climatology. Squared hatches: marine heatwave category I, backslashes: marine heatwaves category II. 18-25 May is peak week of MHW. The Northwest European shelf is also marked with a black line.
Influence of marine heat on land temperature
By using the new method developed by the Met Office’s Dr Ségolène Berthou, the team have been able to show that the May marine heatwave over the Northwest European shelf warmed the UK land temperature by +0.5°C (relative to the 1983-2012 baseline) on average over the month of May.
Dr Berthou explains: “Although May was a fairly cloudy month over the UK, the marine heatwave was found to coincide with generally clear skies and weak wind and wave conditions over the North Sea, which we know drive marine heatwaves.
“These conditions coincided with a weak northeasterly airflow, which allowed the North Sea temperatures to influence UK land. By using our peer reviewed method, we can calculate this influence to be +0.5°C averaged over the whole month.”
In our latest episode of Climate Conversations, Clare Nasir speaks with Dr Ségolène Berthou who led on the new marine heatwave methodology. Watch the video below to learn about the initial study and how they can calculate the influence of marine heatwaves on UK land temperature.
The May 2024 marine heatwave contributed significantly to the land record anomaly. To put it into context, the UK mean temperatures in May broke the previous record by around +1°C. The east coasts of Scotland and England were the most impacted by the marine heatwave where land temperature was increased by 0.8-1.0°C. This is likely because of their location close to the North Sea where the largest SST anomaly is located, and because of the weak northeasterly airflow that dominated in May.
While the UK’s population experienced a cloudy and, in places, wet May, the brighter conditions over the North Sea and northeasterly flow influenced our temperatures, and cloud-cover over land prevented overnight cooling. This goes some way in explaining the disconnect between perception and statistical reality of May 2024. The North Atlantic was also experiencing its warmest May ever recorded at the surface, and it is possible is also contributed to UK temperatures.
Influence of climate change
Sea surface temperatures over the NWS have been increasing by around 0.3°C per decade over the last 40 years and this is leading to more frequent marine heatwaves around the UK.
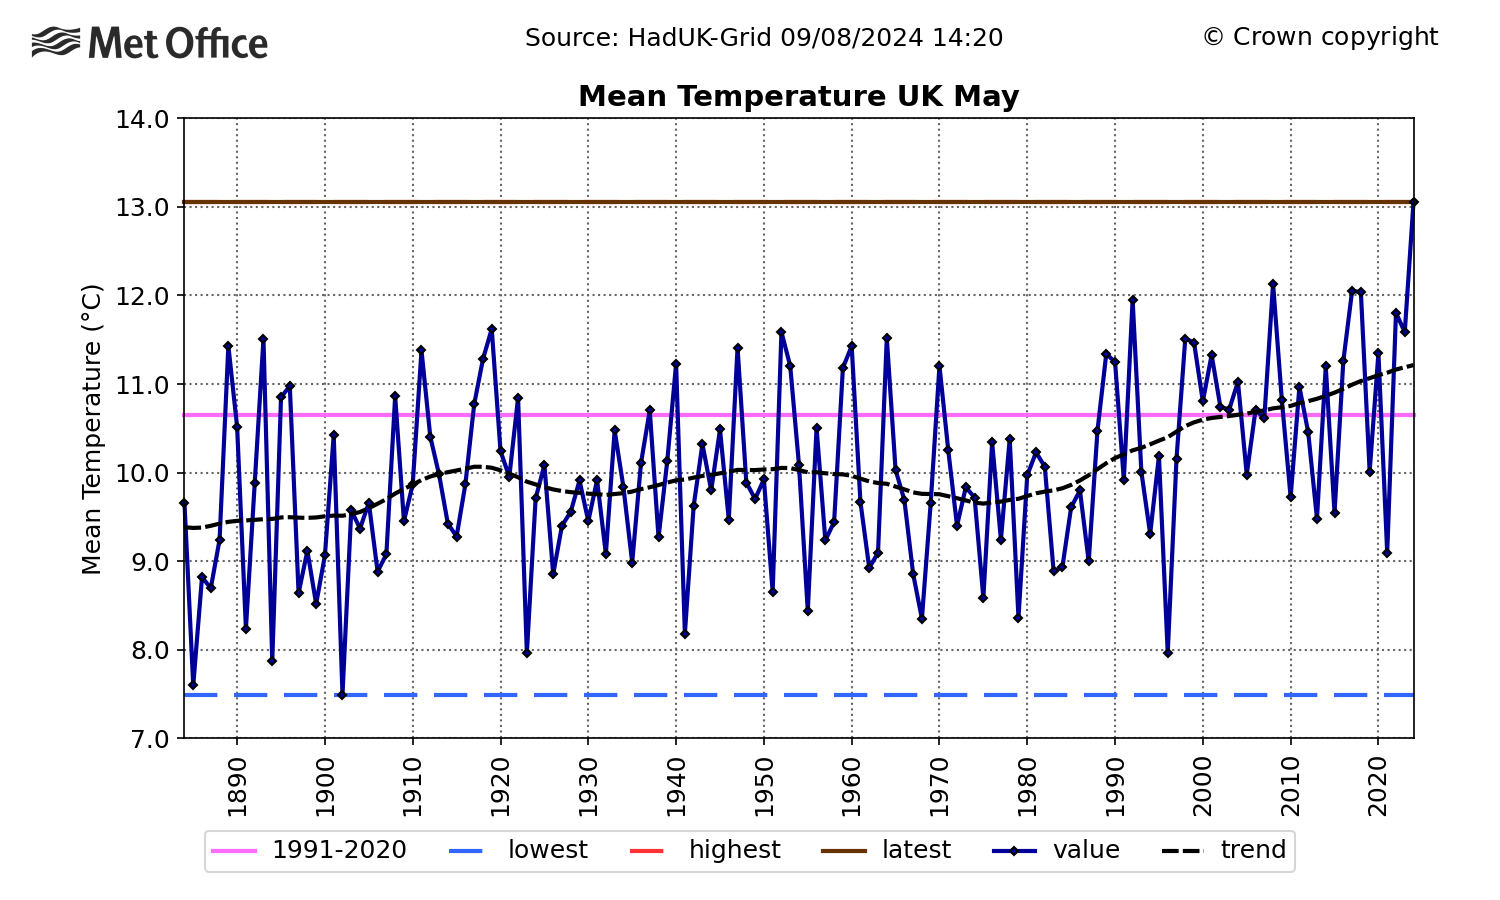
Looking at UK land air temperature for May, as with the annual and seasonal series there is large variability. However, there is a marked increase in May mean temperature from the 1980s onward as shown in the graph below. The May UK mean temperature has increased from 9.76°C in the 1961-1990 averaging period to 10.65°C in the 1991-2020 averaging period. The annual State of the UK Climate goes into much more depth on the influence of climate change on the UK’s months, seasons and years across all meteorological variables.

Graph showing the mean UK temperature for May back to 1884.
Perception vs reality
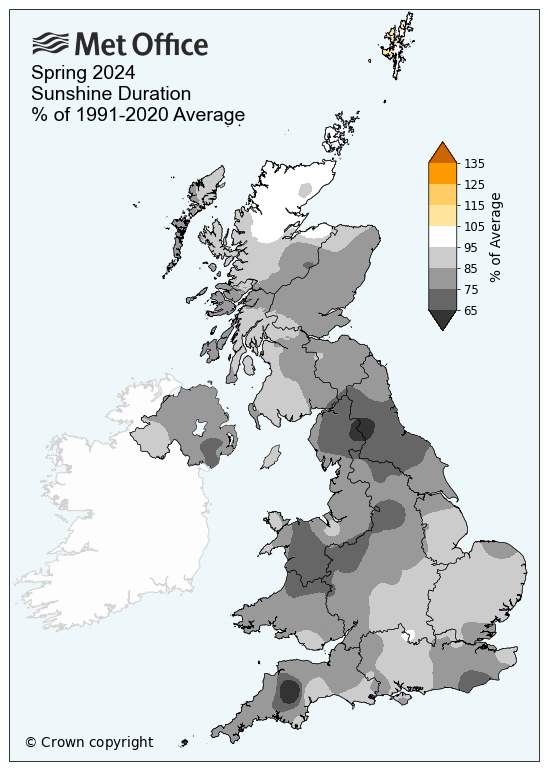
As we all know, it feels much warmer when you’re in direct sunlight. It is the reason we measure air temperature from inside Stephenson screens, to protect the thermometer from the suns direct warmth. With this in mind, the Spring sunshine statistics also help explain people’s perception of the May temperature. As the map below shows, most of the UK had a dull three months through spring, which will have also influenced the feeling of warmth in this transition season when the sun is gaining strength.

May sunshine duration map for the UK.
When combined, the significant influence of a marine heatwave, lack of sunshine through Spring, and the background warming of the atmosphere driven by human induced climate change help explain why record breaking mean temperatures can occur even when people don’t perceive it to have been a particularly warm and sunny month.


