

A new visualisation of Met Office data lays bare the changing climate of the UK using daily temperature data since 1960.
Data shows a 26% increase in above average temperature days (1991-2020) when compared to the climate baseline period of 1961-1990.
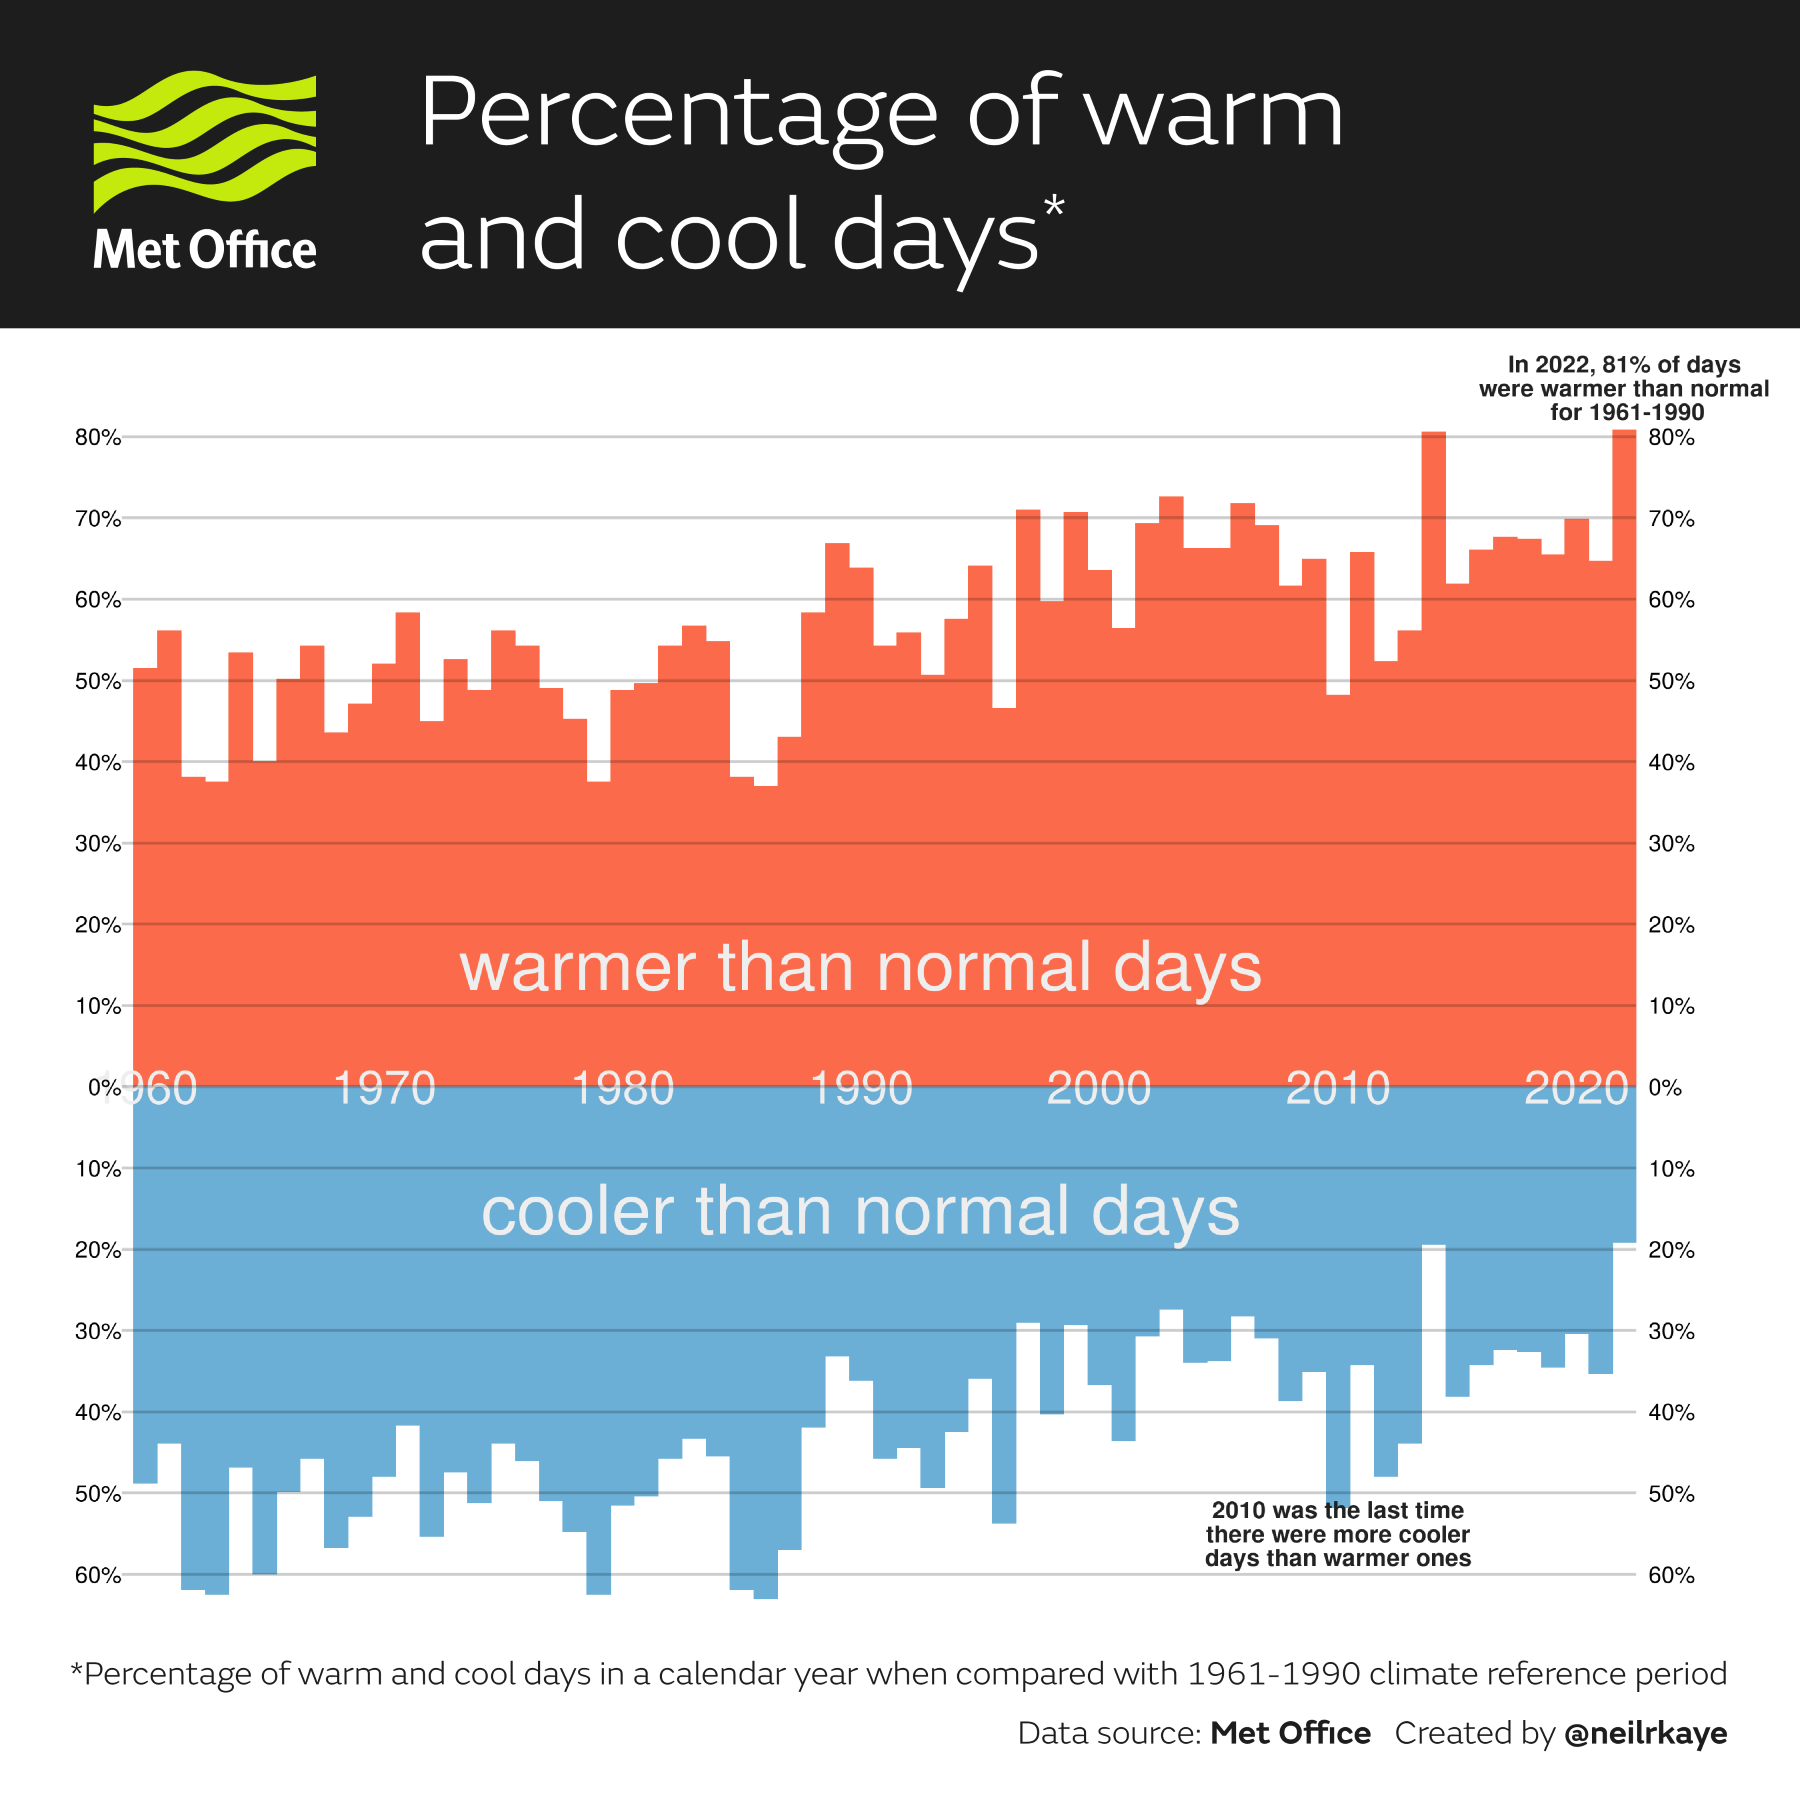
The chart shows how daily average temperatures deviate from the 1961-1990 average in each calendar year and provides a percentage of ‘warmer’ or ‘cooler’ days compared to the baseline period.
Data shows an increasing frequency of days with above average temperatures over a 62-year period in a way that moving 30-year meteorological averages don’t always capture over the long term.
A full scientific assessment of the UK climate will be released later in July with the annual publication of the State of the UK Climate report from the Met Office.
Comparing the latest 30-year averaging period (1991-2020) to the thirty years before that (1960-1991), observations show a 26% increase in temperatures above the average.
The most recent averaging sample of 1991-2020 shows 63% of days warmer than average and just 37% cooler when compared to the 1961-1990 climate reference period. The visualisation uses data from the Met Office’s HadUK-Grid data set.
Met Office Associate Director of Climate Science Albert Klein Tank said: “What we’ve known for a long time is the undeniable warming trend in the UK’s climate. What this visualisation shows is how differences between individual years exist but the overall warming trend is robust and backed up by a range of measurements on the UK’s climate.
“While we often look at average annual temperatures for the UK and can track an increasingly warm trend for the UK since the 1800s, what this data shows is how daily temperatures have shifted since as recently as the 1960s. While cooler days still occur, what you can see is that days like this are becoming less frequent as human-induced climate change moves the goalposts for UK daily temperatures.”
By using average mean temperature across the UK, you can also determine the ten warmest days since 1960 across the UK have all occurred since 1990, with 19 July 2022 topping the table.
In contrast none of the top ten coldest days by the same measurement have occurred since 2010, with the coldest day on 12 January 1987.
A long-term warming trend
The warming of the UK climate is also observed over a longer period of time using annual mean temperatures from the Met Office Had-UK gridded data set. Using 30-year meteorological averaging periods, the average annual mean temperature for the UK over 1961-1990 was 8.3C. For the latest averaging period (1991-2020), the figure is 9.1C.
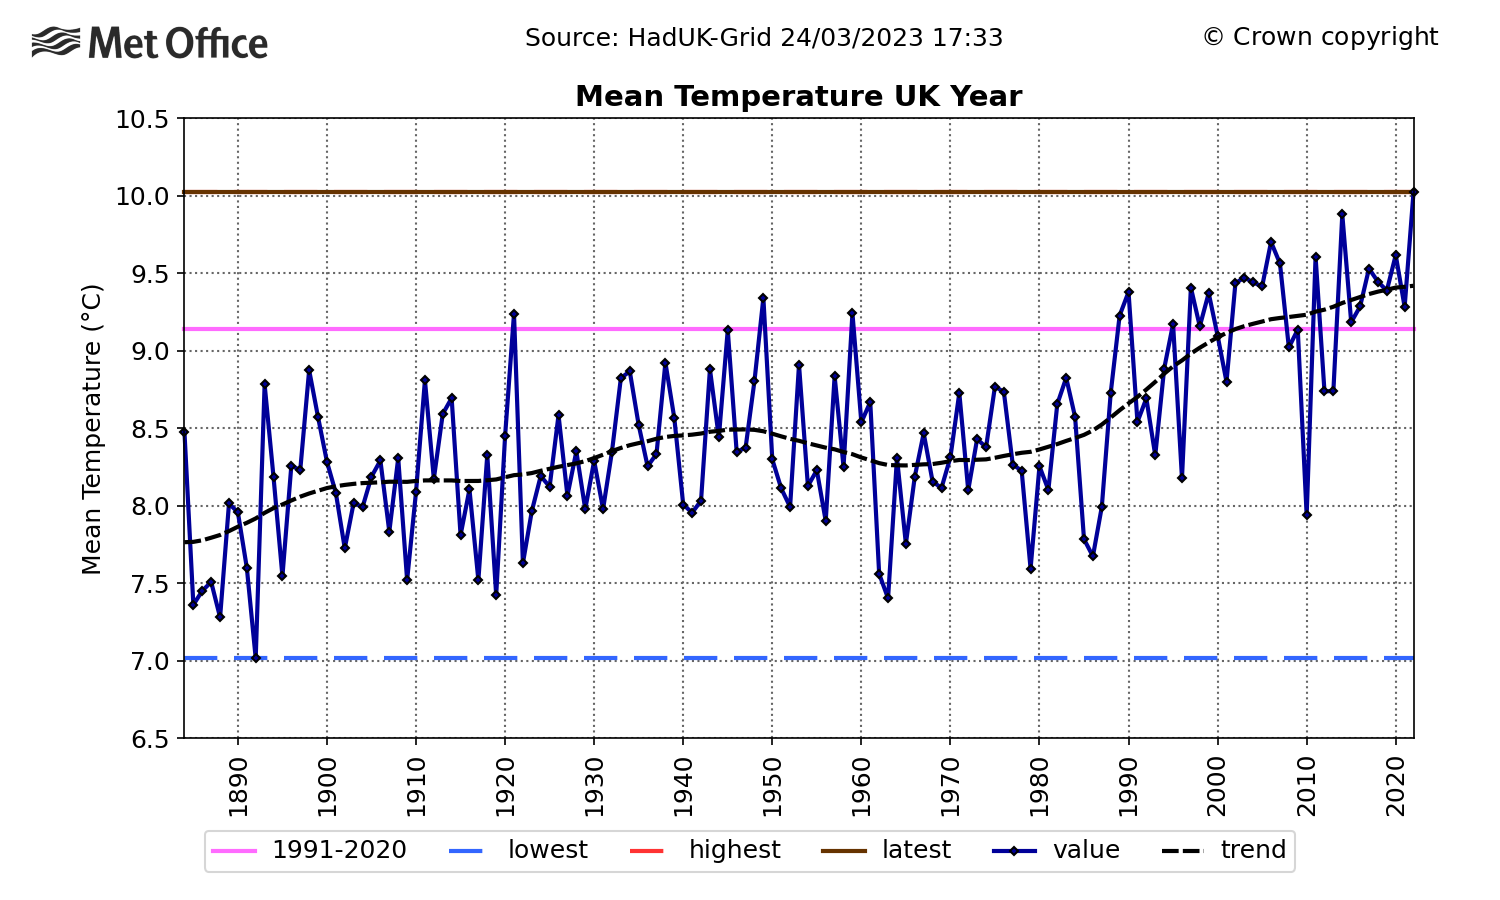
The ten warmest years on record for the UK have all occurred since 2002 in this series which dates back to 1884, while 2022 was the warmest year on record for the UK with an average mean temperature of a fraction over 10C.
In contrast, the ten coolest years on record for the UK all occurred before 1963, with six of the ten coldest years taking place in the 1800s in a series which started in 1884.