Temperature extremes and records most affected by UK’s changing climate
Author: Press Office
00:01 (UTC+1) on Thu 25 Jul 2024
Climate change is causing a dramatic increase in the frequency of temperature extremes and number of temperature records the UK experiences.
New analysis of observations shows that extremes of temperature in the UK are most affected by human induced climate change. This means the UK is seeing, on average, more frequent periods of hot weather, bringing challenges for infrastructure, health and wellbeing. The observations also suggest an increase in rainfall extremes.
The new analysis features in this year’s annual publication of the ‘State of the UK Climate’ report. Published in the Royal Meteorological Society’s ‘International Journal of Climatology’, the report is a comprehensive review of the UK climate and significant weather events through 2023. This report is based on observations from the UK’s network of weather stations, using data extending back to the 19th Century to provide long term context.
Using an example of 28°C, the frequency of days reaching this threshold has increased nearly everywhere across the UK. Where in the 1961-1990 averaging period only London and Hampshire recorded six or more days over 28°C, by the latest decade (2014-2023) this has spread across much of England and Wales, with frequencies in the south east increasing to over 12 days each year in many counties.
The expansion of the area of darker shades in the maps illustrates how the number of ‘hot’ days each year has increased across all geographic regions of the UK.
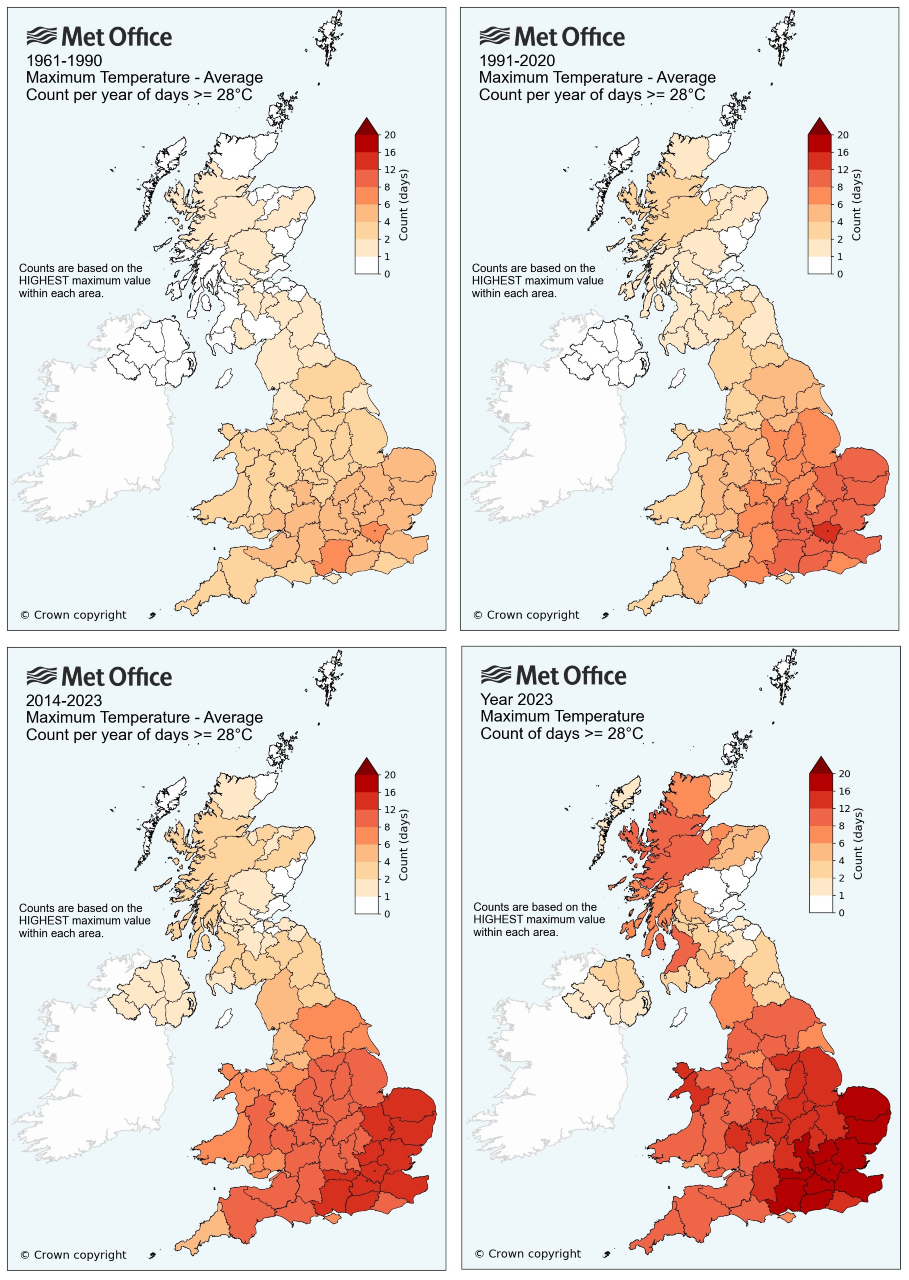
Average count of the number of days per year in which the highest maximum temperature within each county of the UK has exceeded 28°C – indicating a ‘hot’ day – covering the periods 1961-1990, 1991-2020, 2014-2023 and actual counts for year 2023. The scale extends to 20 days. Counts are based on 1km resolution gridded climate data from the HadUK-Grid dataset.
Furthermore, the proportional increase across all counties over time is much more pronounced as the temperature threshold gets higher. The number of ‘pleasant’ days (daily maximum 20°C) has increased by 41% for the most recent decade (2014-2023) compared to 1961-1990. The number of ‘warm’ days (25°C) has increased by 63%, ‘hot’ days (28°C) have more than doubled and ‘very hot’ days (30°C) have more than trebled over the same period.
Although rainfall has a much higher natural variability than temperature, it is still possible to identify an increasing frequency of the wettest days over time too. By taking the top 5% of wettest days during the 1961-1990 averaging period it is possible to see how frequent these very wet days have been in the most recent decade (2014-2023).
The most recent decade has had around 20% more days of exceptional rainfall compared to the 1961-1990 averaging period. While there is no significant signal for this change being more pronounced in a specific area of the UK, overall, this analysis clearly shows an increase in the number of very wet days in the UK’s climate in recent years compared to what was observed just a few decades ago.
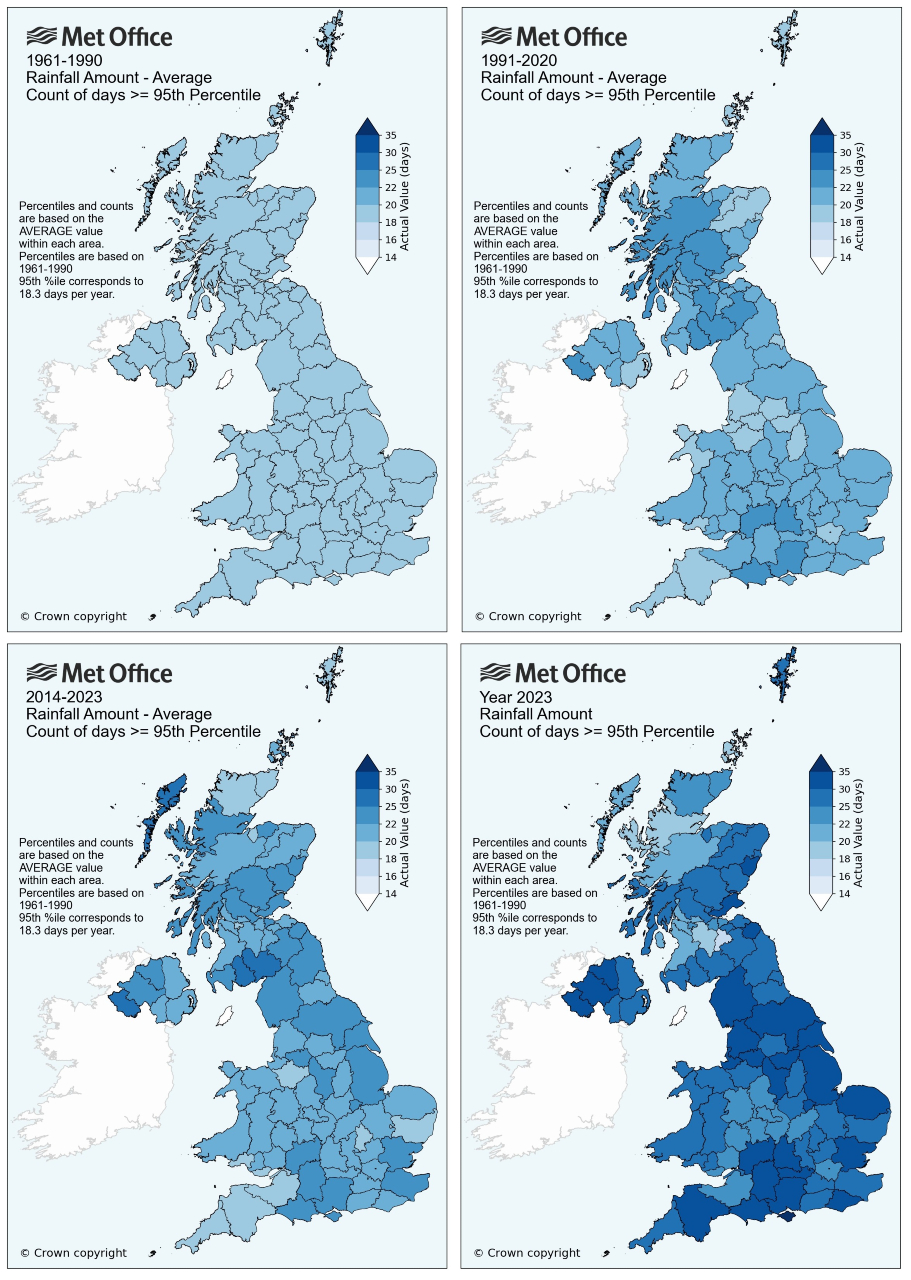
Average number of days per year for 1961-1990, 1991-2020 and 2014-2023 and actual number of days for 2023 in which the daily rainfall total for each county of the UK has exceeded the 95th percentile daily rainfall for that county based on the period 1961-1990. The 95th percentile corresponds to 1 in 20 days or 18.3 days per year, by definition – as shown on the map for 1961-1990. The legend scale extends to 35 days. Daily totals are based on the average value across each county.
Lead author and Met Office climate scientist, Mike Kendon, said: “Our new analysis of these observations really shines a light on the fastest changing aspects of our weather as a consequence of climate change. Long term averages can be difficult for people to relate to, but what we are showing here is the notable change in frequencies of extreme weather that can have a real impact on people’s lives.
“2023 was another year of interesting and at times significant weather. From the UK’s record warmest June by a wide margin, to a significant September heatwave and the most active start to the storm naming season culminating in serious flooding problems in the autumn, it was another year of typically varied weather. But underlying this natural variability is a continuing and increasing influence of climate change which is influencing the weather we experience.”
Attributing our changing climate
A number of climate attribution studies were completed by Met Office scientists through 2023. These studies examine the influence of human activity on our climate by using computer models to compare the likelihood of the same event happening in a ‘natural’ environment (without the effects of man-made greenhouse gas emissions) against the likelihood in our current climate.
Attribution studies were conducted on the record breaking June monthly temperature, the joint warmest September on record and the year as a whole being the second warmest on record for the UK. All of these studies found that human induced climate change had made them much more likely to happen than they would have been in a natural climate.
Professor Liz Bentley, Chief Executive of the Royal Meteorological Society, said: “This report is the authoritative annual summary of the UK climate published as a special supplement in our International Journal of Climatology. It not only helps to highlight the latest knowledge on our changing climate but also enables us to understand the trends, risks and impacts to help inform how we will need to adapt, now and in the future.
“The new analysis of days that are classified as ‘hot’ or having ‘exceptional rainfall’ highlights the increased frequency in high impact extremes we are already experiencing in the UK, and the attribution studies help to understand how human activities, such as burning fossil fuels, are making these extreme events much more likely to happen as our climate continues to change.”
Year in review
The report gives a comprehensive assessment of the UK climate through 2023 and uses recent and past climate averaging periods to put the months, seasons and year as a whole into context.
2023 was the UK’s second warmest, seventh wettest and 22nd sunniest year in records dating back to 1884, 1836 and 1910 respectively. There was of course regional variability, with Wales and Northern Ireland recording their warmest years on record for example.
March, July, October and December 2023 were all top-ten wettest months in the UK monthly rainfall series from 1836; the first year this has happened for four separate months in the same calendar year. February, May, June and September 2023 were all ranked in the top-ten warmest months for the UK in the monthly series from 1884.
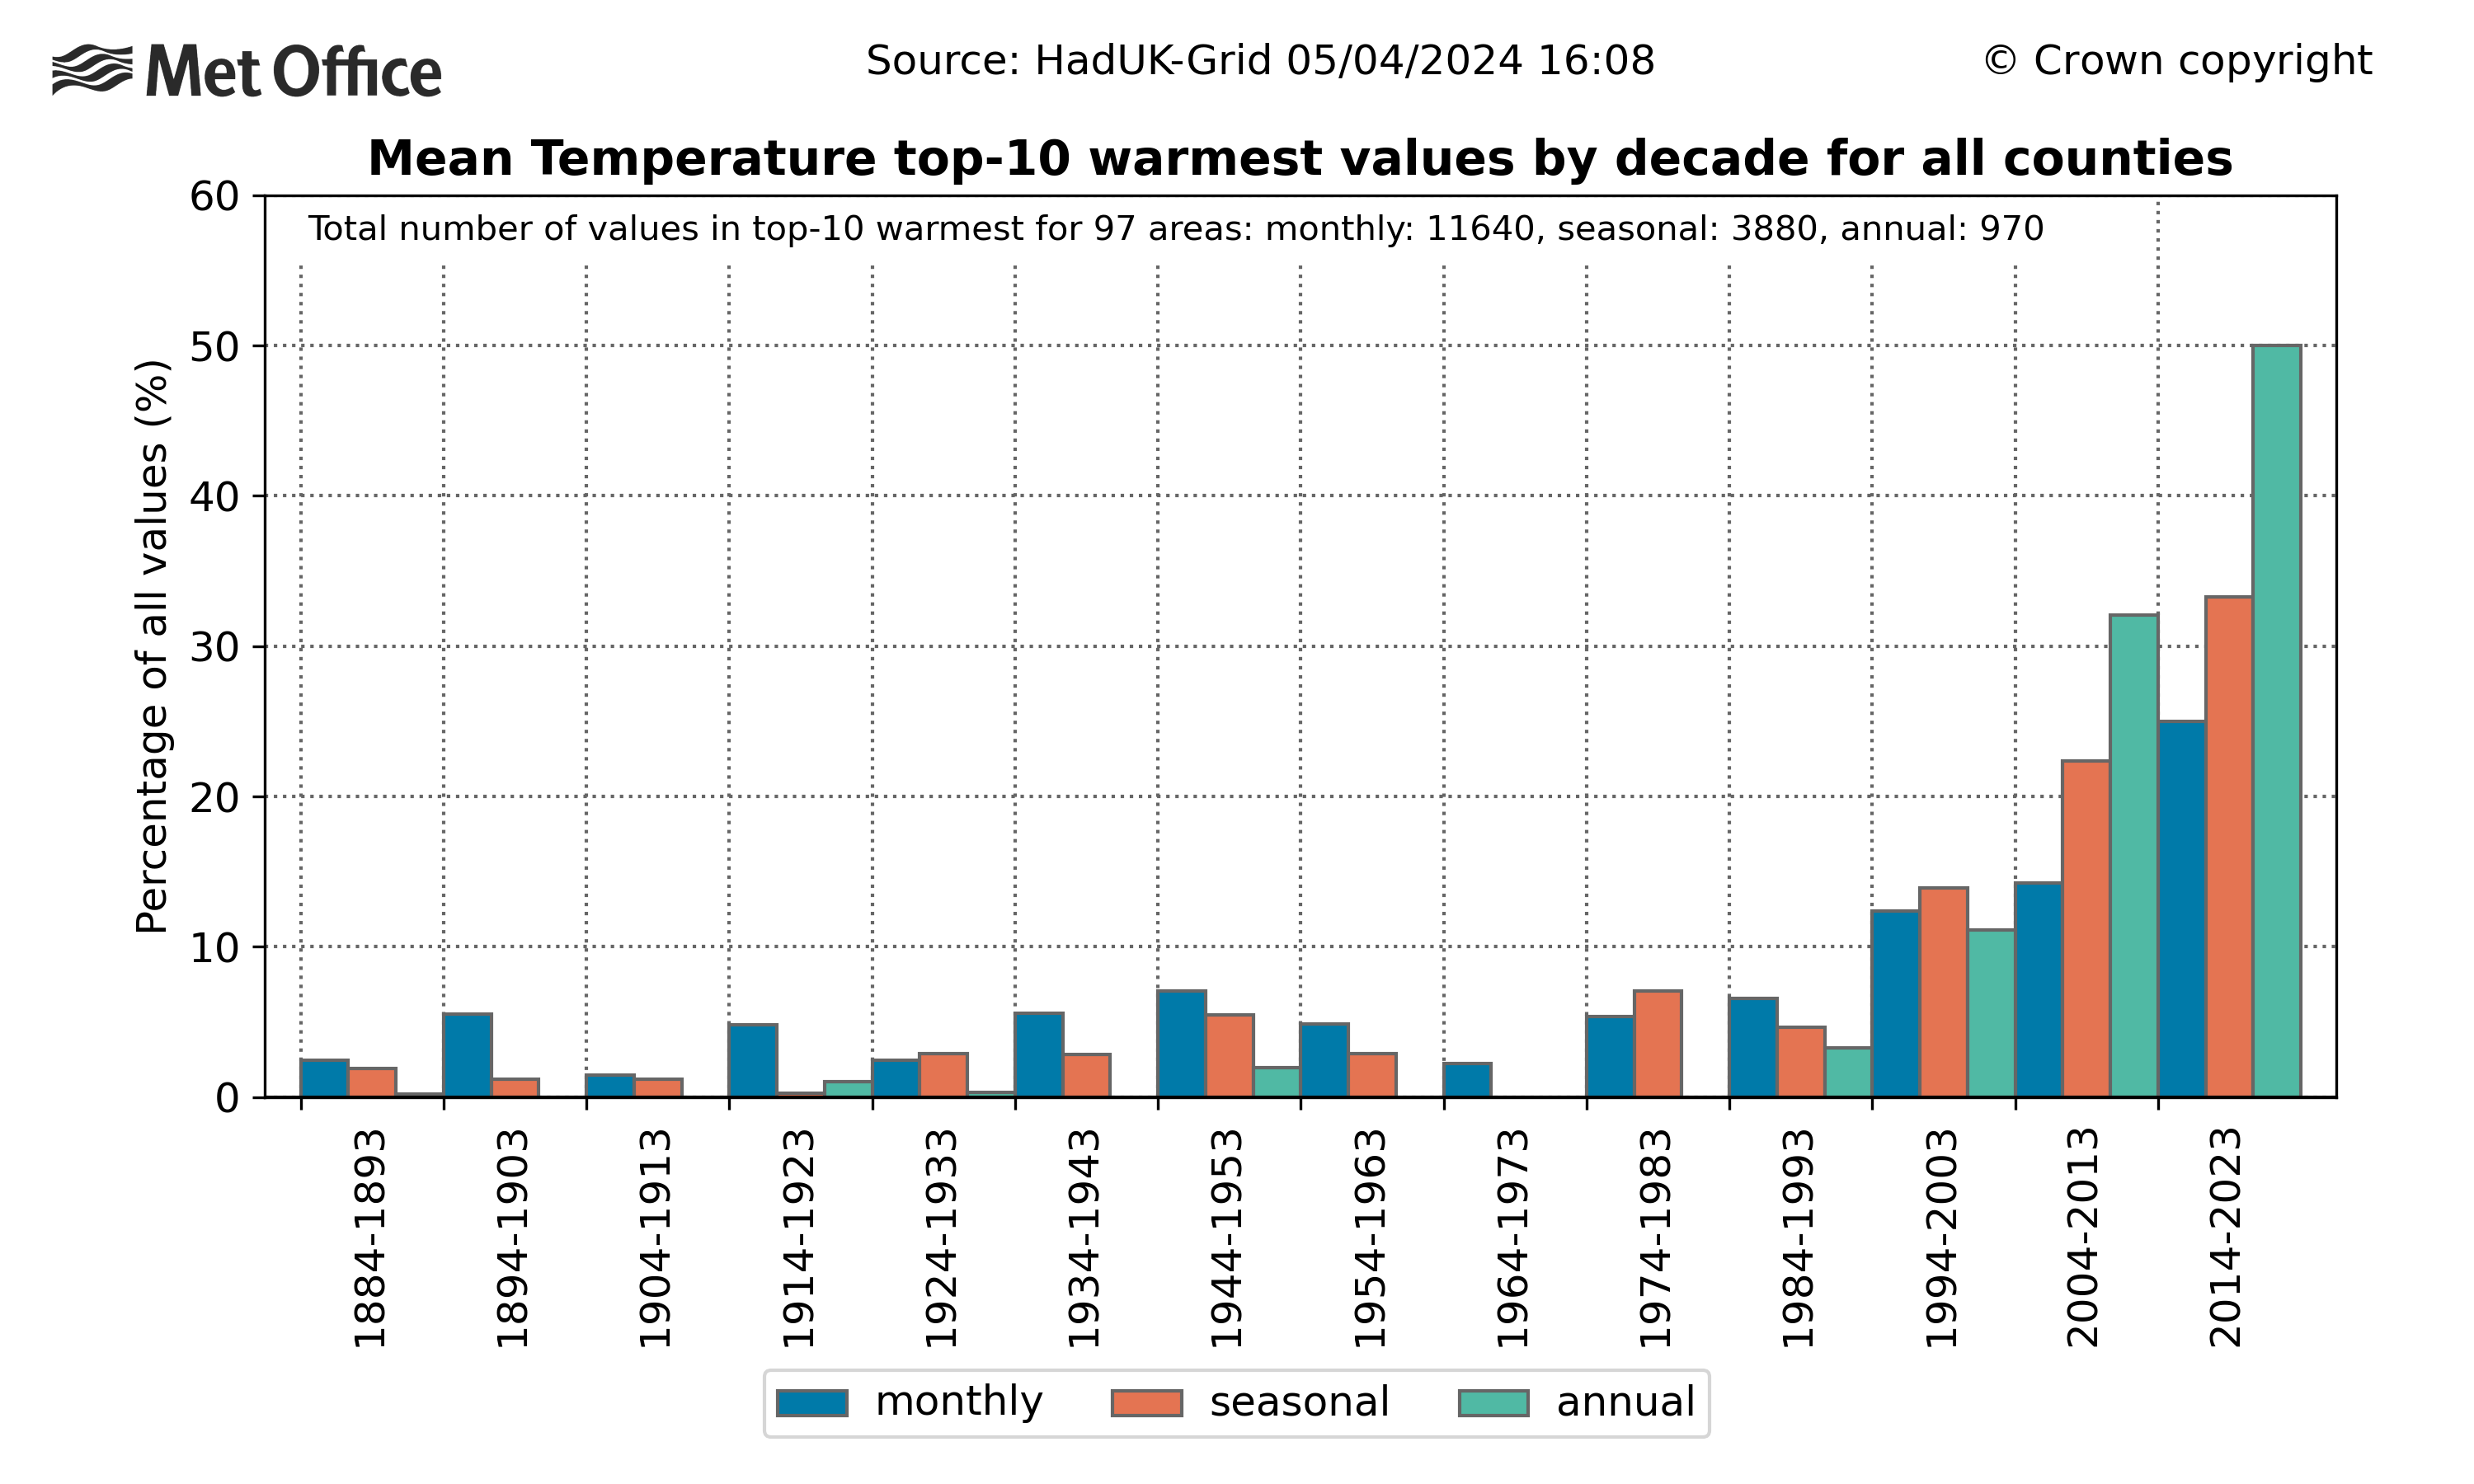
The report shows a huge increase in top-ten warmest monthly, seasonal and annual records for counties of the UK in the most recent decade 2014-2023, compared to virtually no top-ten coldest records. For the UK overall, the most recent record warmest (or equal warmest) months for UK average monthly temperature have been May 2024, September 2023, June 2023, December 2015 and April 2011, whereas the last record cold month was December 2010.
Although changes in rainfall are less pronounced, they also indicate a recent increase in top-ten wettest monthly, seasonal and annual records but no obvious trend in top-ten driest records.
The most recent decade (2014-2023) has been on average 0.42°C warmer than the 1991-2020 average and 1.25°C warmer than 1961-1990. The change in UK annual mean temperature is broadly in line with global temperature changes over land. UK winters for the most recent decade (2014-2023) have been 9% wetter than 1991-2020 and 24% wetter than 1961-1990, with smaller increases in summer and autumn and none in spring.
Significant weather events in 2023
Significant weather events through 2023 include the record warm June, coinciding with a significant marine heatwave. 30°C was recorded in September in the UK on seven consecutive days for the first time on record, and unusually, the hottest day of the year was recorded in September (33.5°C on 10 September).
Scotland had its wettest 2-day period on record on 6 to 7 October in a daily series from 1891, 65.9mm, 39% of the 1991-2020 October whole-month average.
The 2023-2024 storm season had its most active start with respect to the number of named storms since storm naming was introduced in 2015, with seven named storms (Agnes to Gerrit) from September to December. Storm Babet brought widespread prolonged and heavy rainfall and was the UK’s most impactful weather event of the year. Eastern Scotland – where a red warning for rain was issued – was particularly badly affected due to an unusual south-easterly flow with increased rainfall across high ground. Winds from storm Ciarán on 2 November had the potential to be as severe as from the ‘Great Storm’ of 16 October 1987, but the strongest winds missed the UK to the south.
The UK recorded its wettest September to December period since 2000 due to persistently wet and unsettled weather, including the sequence of named storms from Agnes to Gerrit.
Sea level change
A section of the report authored by the National Oceanography Centre (NOC) assesses sea level change around the UK.
Data from the tide gauge at Newlyn, one of the longest available records around the UK, continues to show that sea level is rising, with 2023 the highest year on record for annual mean sea level since records began. Ongoing problems with observations mean an accurate assessment for the whole of the UK cannot be produced, but other sites around the UK also had their highest or second highest year on record.
The rate of sea level rise at Newlyn also continues to increase, with most recent trends estimating a rise of 4.6 ± 0.9 mm per year (1993-2023).
Dr Svetlana Jevrejeva is a sea level scientist at NOC, she said: “Tide gauge records provide robust observational evidence that sea level around the UK continues to rise due to increased rate of ice loss from the Greenland and Antarctic ice sheets, as well as continued glacier mass loss and warming of the ocean. The sea level record from Newlyn, one of our longest records starting in 1915, showed exceptionally high periods in 2023 especially in the second half of the year, which could lead to the greater impacts from storm surges observed during Autumn/Winter. In 2023 there were 16 extreme storm surge events, affecting coastal communities and infrastructure.”
Phenology
The report also includes a section on phenology, the study of seasonal changes in plants and animals from year to year, authored by the Woodland Trust. It summarises the wider citizen science project run by the Woodland Trust called ‘Nature’s Calendar’.
Biological indicators for spring 2023 were generally near-average or later compared to the 1999–2022 baseline. Insect activity, in particular, appeared later. However, Hazel had its earliest flowering date in a series from 1999.
Bare tree dates in autumn were a few days later than the 1999–2022 baseline due to warm September temperatures and a generally mild autumn.
Overall, the 2023 leaf-on season was slightly longer than the 1999–2022 baseline, although the shorter lawn cutting season might be attributed to a complex mixture of low temperatures in early March inhibiting growth and wet grass in autumn discouraging late cutting.
Citizen Science Officer at the Woodland Trust, Dr Judith Garforth, said: “In the UK, phenology data are provided by volunteers who observe their local surroundings and record the first occurrence of key seasonal indicators across different wildlife species.
“2023 was a near average or late year for most events, with the exception of hazel flowering, which was 12 days ahead of the baseline, and elder first leafing. This illustrates how the effect of weather on UK wildlife is complex – the impact is unique for each species and seasonal event, and of course weather can be very localised too. That's why it's so important that we have volunteers all over the UK monitoring wildlife on their doorsteps - without their help we wouldn't have this valuable insight.”