World Area Forecast System (WAFS) - upcoming changes

Both WAFC London and WAFC Washington have been working to develop the next generation of WAFC SIGWX forecasts, these changes will improve efficiency and safety, bringing environmental and operational benefits.

These forecasts will become operational in January 2025. Test data sets are available on SADIS API to prepare meteorological visualisation systems and flight planning software to display and process the new SIGWX forecasts.

Please access this flyer which summarises all the upcoming changes

What do you need to do?

1. Make sure that your software provider or IT department is aware of the upcoming changes and encourage them to start setting up systems to pull test data from the new SADIS or WIFS API.

2. Upgrade systems to be able to visualise the new IWXXM format SIGWX data sets.


SIGWX plot

These new and improved data sets will contribute towards limiting the environmental impact of air travel, cope with increased traffic and capacity demands and help air traffic management strategies to mitigate against and avoid hazardous weather conditions.    

A series of webinars took place to explain the upcoming changes, please find the resource below:

Note: these resources were created prior to the change in date to January 2025


Contents:

What will the new SIGWX data contain?

Benefits of the new SIGWX forecast

What will happen to the existing T+24 SIGWX charts and BUFR files?

BUFR Test Data

Performance Metrics

Probabilistic WAFS forecasts

SIGWX FAQ’s


What will the new SIGWX data contain?

The new SIGWX data will be produced in a new IWXXM format (a form of XML) and will contain the following features:

  • Jet streams
  • MOD and SEV turbulence areas, with information on upper and lower flight level affected. The turbulence areas will be based on the WAFS turbulence severity data set.
  • MOD and SEV icing areas, with information on upper and lower flight level affected.
  • OCNL and FRQ cumulonimbus areas, with information on the flight level of the cumulonimbus top.
  • Tropopause height contours
  • Erupting volcano, tropical cyclone, and nuclear release markers.


Benefits of the new SIGWX forecasts

  • Forecasts extended by 48 hours ahead, assisting with flight planning and situational awareness
  • 3-hour intervals allowing observation of moving and evolving features
Labels have been removed for a clearer example. Grey indicated turbulence, purple indicates icing (dark shades indicated more severe conditions) Cumulonimbus areas (OCNL and FREQ) are the red scalloped areas.  Tropopause contours are yet to be finalised


  • Forecasts will be produced from a more recent model run.
WAFS timeline

The diagram above shows this for a flight taking off at 14:00 on 2nd February

  • Previously you would be limited to using a T+24 forecast, based off the 12Z model on issued at 18:50.
  • The updated SIGWX, will allow you to use the T+6 and T+9 forecasts based off the 06Z model on the 11:30 issued on the 2nd of February.
  • SIGWX will now have forecasts available out to T+48, SIGWX forecasts for this flight would have been issued at approx. 23:30 on 31st January (based off the 18Z model run on the 31st). 


  • SIGWX forecasts that are fully consistent with the WAFS gridded data.
  • Areas of icing that cover the entire globe (instead of only regionally).


What will happen to the existing T+24 SIGWX charts and BUFR files?

  • The T+24 Medium Level and High Level SIGWX charts will continue to be published until November 2028 on SADIS FTP, after which they will be retired.  They will be created from the new SIGWX data sets.
  • The T+24 BUFR files will be retired in January 2027.
  • Changes to the appearance of the T+24 SIGWX charts:
    • Only areas with a cumulonimbus coverage of 50% or greater (i.e. OCNL and FRQ) will be included, excluding Embedded cumulonimbus areas. Meaning that "ISOL EMBD CB" will not be included.
    • Tropopause information will be shown as contours at 5000ft vertical intervals, instead of spot heights.
    • The medium level SIGWX will combine the in-cloud turbulence and icing areas into an overall solely icing area.
    • Changes to drawing style, based on the WAFS gridded turbulence data set
  • T+24 SIGWX charts will be produced in colour and a different line style will indicate icing areas.  Examples are shown below: 

Example High Level SIGWX (SWH) chart. 

Example Medium Level SIGWX (SWM) chart. 

Please refer to the SIGWX Interpretation guide which gives a detailed explanation of the new style SIGWX.


BUFR Test Data

The BUFR data files will remain largely the unchanged, apart from the following:

  • Tropopause spot heights will continue to be used.
  • The medium level files (SWM) will be produced for all four fixed medium chart areas routinely, the data in the BUFR file will cover the globe.
  • Areas of icing that line inside of cumulonimbus areas will be removed, so current scalloped line styles can be used by systems without the ability to change the icing line style or colour.


Test data sets are available here and will be updated regularly:

Performance metrics

WAFC SIGWX Verification carried out by WAFC London, compares the performance between the new SIGWX forecasts compared to the T+24 SIGWX forecasts.  WAFC London Performance metrics and WAFC Washington Performance metrics underpin the WAFS gridded data sets which the available SIGWX forecasts are using.


Probabilistic WAFS forecasts

The WAFC’s are planning to introduce probabilistic WAFS hazard data sets in November 2027, which will become fully operational in November 2028. 

They are expected to consist of the following:

  • Probability that the Turbulence Severity will have an Eddy Dissipation rate higher than some set thresholds (equating to moderate or greater in intensity)
  • Probability that the Icing Severity will be Moderate or greater in intensity
  • Probability that the cumulonimbus cloud tops will exceed height thresholds.
  • Initially there will be 6 turbulence levels, and 5 icing levels provided at a horizontal resolution of 0.5 degrees. Data will be provided for the 6-hour to 48-hour forecast period at 3-hour intervals.

Some preliminary example plots are shown below:

1) Probability that the Turbulence Severity Eddy Dissipation rate will exceed 0.2.
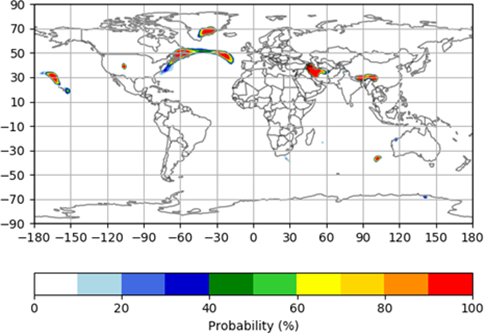
Probabilistic turbulence

2) Probability that the Icing Severity will be moderate or greater in intensity

Probabilistic turbulence

3) Probability that the cumulonimbus cloud tops will exceed 35,000ft.

Probabilistic CB


SIGWX FAQ’s

1. Why are embedded (EMBD) cumulonimbus (CB), and in particular “ISOL EMBD CB” not included in the SIGWX forecasts any more.

The WAFCs do not have meteorological model output that indicates whether cumulonimbus clouds are embedded in other cloud or not. Whether a cumulonimbus is embedded is subjective and depends on the pilot’s viewpoint and flight level.

For this reason, the WAFCs will be filing a difference against ICAO Annex 3 to facilitate this change in the SIGWX content.  This means that ISOL EMBD CB will not be provided as “isolated” cumulonimbus clouds (less than 50% coverage) are not a criteria for the SIGWX forecast as per Annex 3. Areas where the cumulonimbus clouds are more concentrated with more than 50% coverage (being OCNL or FRQ in nature) will still be included.

With Amendment 82 to Annex 3 in November 2025 the requirement for EMBD CB in the SIGWX will be removed.

WAFC forecasts are primarily for en-route activities, and modern aircraft have radar systems that can identify the location of larger precipitation sized water droplets which indicate the location of heavy rain or thunderstorms in a larger mass of cloud.

The WAFS gridded cumulonimbus data sets should be the primary tool used to identify where thunderstorms may be expected to occur.   

2. Why are cumulonimbus bases not included/shown?

Cumulonimbus bases are almost always below flight level 100 (FL100) and are therefore below the base which the SIGWX forecast is valid for and marked as “XXX”.  The decisions aviation users make are unlikely to change on the rare occasion that the cumulonimbus base might be FL110 or FL120, therefore this will not be part of the updated SIGWX data set.

3. Why has CAT changed to turbulence – what is the difference?

The WAFCs upgraded how turbulence is forecasted in the gridded WAFS data sets in November 2020, the algorithm used is able to forecast both clear air turbulence (CAT) and orographic turbulence types. 

4. Where did the in-cloud turbulence field go?

Due to its low forecast skill in-cloud turbulence was retired in early 2021. Therefore, there will be no in-cloud turbulence in the creation of the SIGWX forecasts.

5. Why is the new SIGWX spanning FL100 to FL600 and not split into medium and high-level versions?

The new SIGWX features all contain vertical information and users could, via their meteorological or flight planning software provider, filter the information vertically when creating charts/visualisations from it if they chose to.  This approach gives the maximum flexibility to end users.

6. What will the differences between the EGRR (WAFC London) and KKCI (WAFC Washington) versions of SIGWX be?

Each WAFC uses their own wind and tropopause data in the creation of the jet stream and tropopause height features.  The cumulonimbus, icing and turbulence features are created from the WAFC blended hazard data sets, and if the blending has successfully taken place those SIGWX features should be identical.  Each WAFC producing their own set of SIGWX products allows resilience in the production system.

7. Why aren’t we providing briefing quality charts on for the new SIGWX forecasts?

For each issue of the T+24 SIGWX products 18 different briefing quality charts are produced.  This would not be sensible for the new SIGWX forecasts which have 15 different forecast timesteps and would require 270 different charts to be handled.  By providing digital data it enables meteorological or flight planning software to display and then create customised charts that suit their user needs in terms of colour schemes, map areas and map projections. 

8. What is IWXXM?

IWXXM is an information model designed for the operational exchange of meteorological information for aviation, which is specified in ICAO Annex 3.  A World Meteorological Organisation task team created the schematron for SIGWX in conjunction with the WAFC’s, and WMO are responsible for the release and publication of the IWXXM schematrons.  They are published by WMO here: https://schemas.wmo.int/iwxxm/.  The schema being used for SIGWX can be found in the 2023-1 directory, and is called the “WAFSSigWxFC” schema. 

Get in touch

Call us

We are available 24/7.

0370 900 0100

Email us

Fill out this short form and we'll get back to you.

Contact Us form

Follow us

Linkedin X

Get in touch

Call us

We are available 24/7.

0370 900 0100

Email us

Fill out this short form and we'll get back to you.

Contact Us form

Follow us

Linkedin X