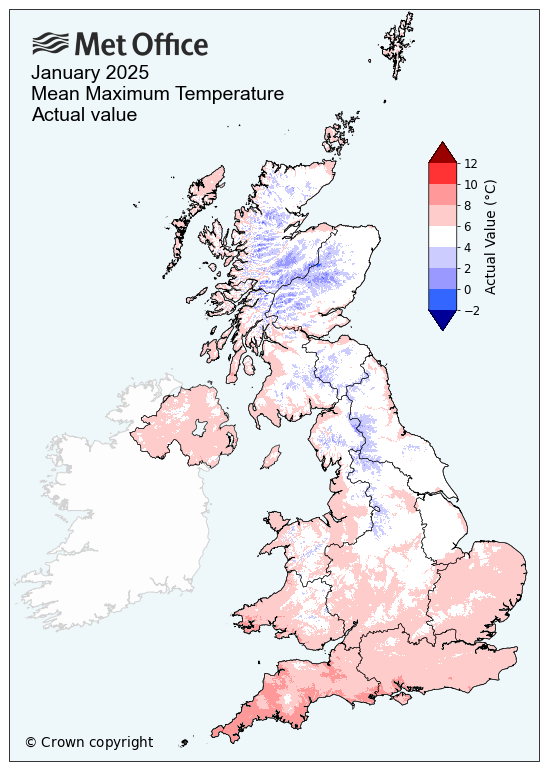
UK actual and anomaly maps
Maps of climate variables for previous months, seasons and years

Maps of climate variables for previous months, seasons and years

The actual and anomaly maps are based on gridded data sets, with the anomaly information referring to the 30-year averaging periods 1961-1990 and 1991-2020.
Seasonal and annual maps are only available for: mean daily maximum temp.; mean daily minimum temp.; mean temperature; rainfall and sunshine.
Rainfall maps include all precipitation (rainfall, snow and hail).
All maps (except for lightning strikes) are based on the HadUK-Grid dataset. Maps for the most recent year are provisional. Maps for previous years are updated on an annual basis in-line with the latest version of this dataset.