
Briefing on Arctic and Antarctic sea ice - June 2024
Alex West and Ed Blockley
Summary
- Arctic sea ice extent is below average for the time of year, but not exceptionally so.
- Winter 2023-24 was very mild in the Canadian and Central Arctic but nearer average in the East Siberian Arctic; end of winter ice thicknesses estimated by satellites reflect this.
- April and early May temperatures, and sea ice loss to the end of May, have been near-average across much of the Arctic, but this does not preclude severe sea ice melt during the summer; it is not possible to make a reliable forecast of September sea ice melt at this point in the season.
- Antarctic sea ice is currently growing towards its seasonal maximum but remains well below average for the time of year.
Arctic
Sea ice state
Arctic sea ice extent on 10th June 2024 was 11.21 million sq km (Figure 1) according to data from the National Snow and Ice Data Center (NSIDC). This was 0.87 million sq km below the 1981-2010 average, and was the 8th lowest value on record observed for this date, the lowest having been 10.86 million sq km in 2016.
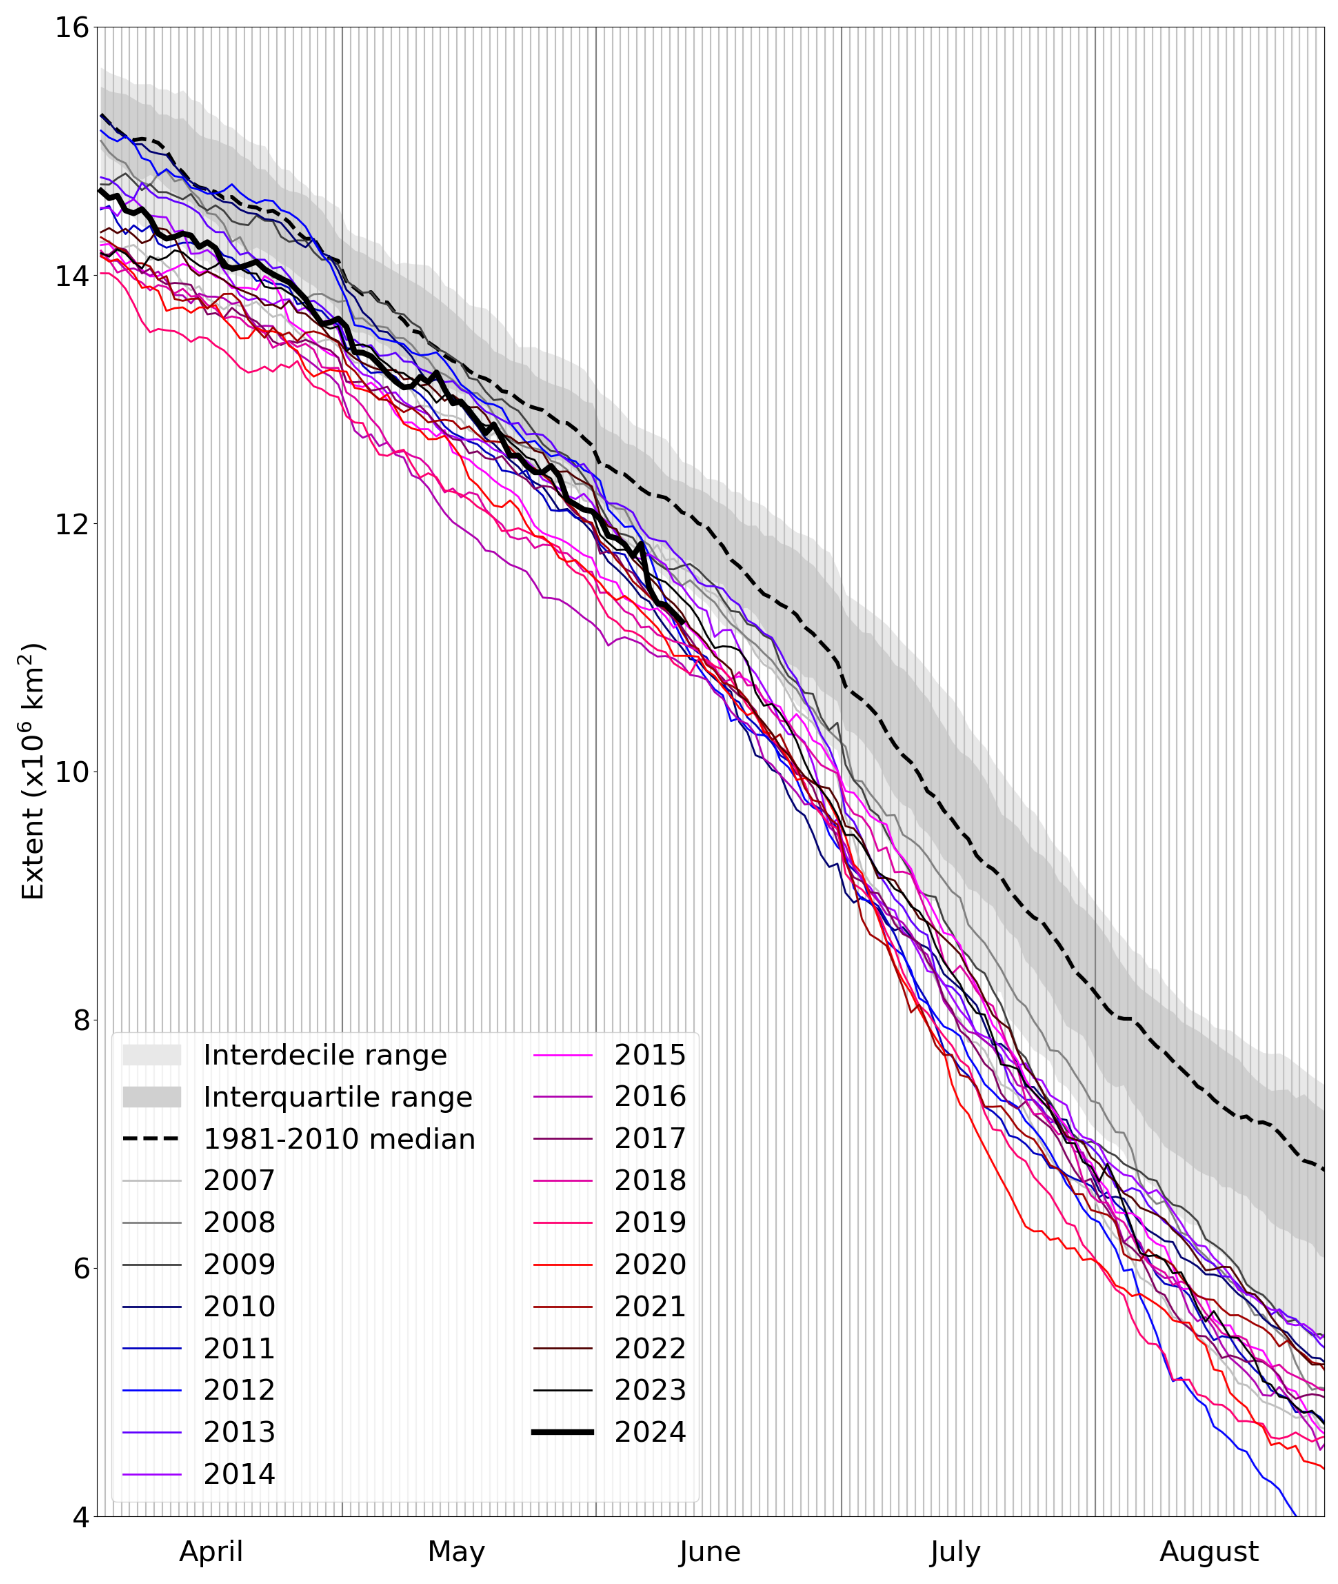
Figure 1. Daily Arctic sea ice extent for 2024, compared with recent years and the 1981-2010 average with interquartile and interdecile ranges shown by the shaded areas. Data are from the National Snow and Ice Data Center (NSIDC).
Extent was below average across most seas of the Arctic Ocean. The main exceptions were the East Siberian Sea and the central Arctic Ocean, where substantial open water areas had not formed at the time of writing, as well as the Bering Sea. Across all other parts of the Arctic, substantial melting was already occurring.
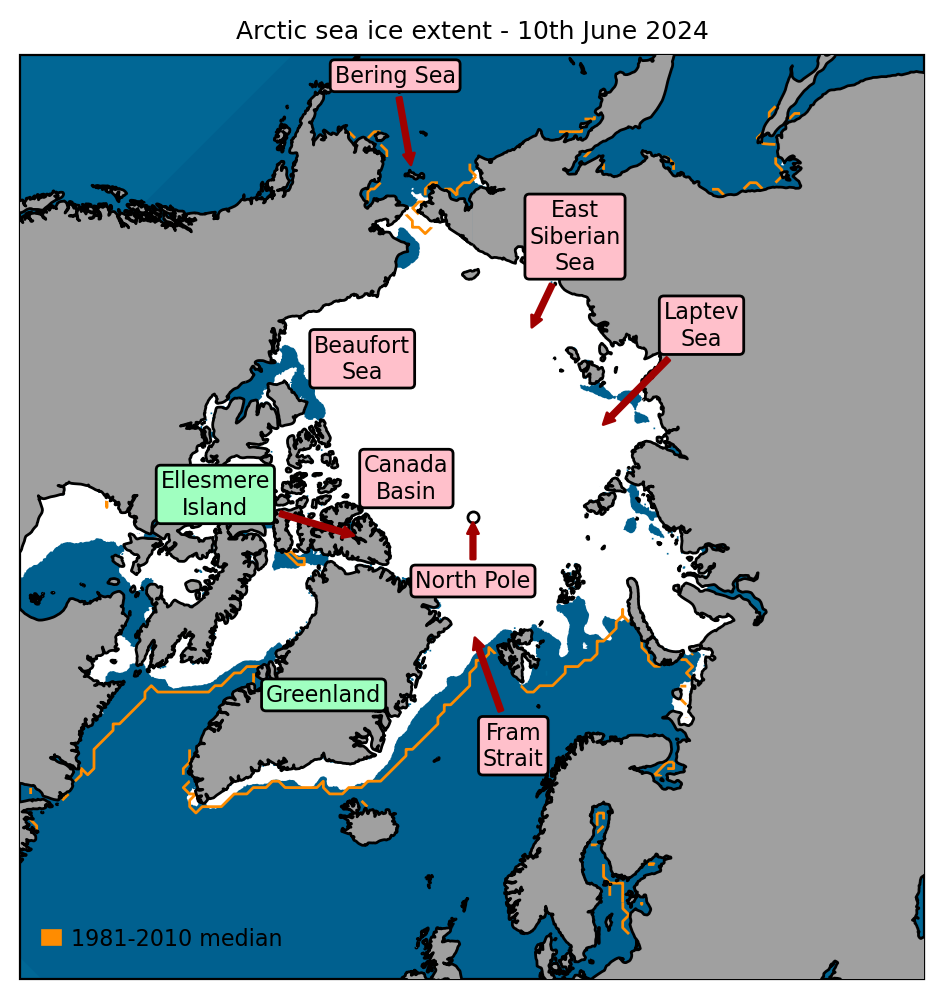
Figure 2.Arctic sea ice extent on 10th June 2024, with 1981-2010 average extent indicated in orange, and the regions referred to in the text labelled. Data are from EUMETSAT OSI SAF (Tonboe et al., 2017).
Arctic winter and spring in context
Winter 2023-24 in the Arctic was much milder than the 1981-2010 average, with an anomaly of +2.3°C. As measured by the average temperature above 70°N from November-March at 925hPa (about 1km high in the atmosphere), it was the joint-third warmest winter on record, with only the winters of 2015-16 and 2017-18 having been warmer (Figure 3). It was particularly mild relative to average in the Canada Basin north of Ellesmere Island and across much of the Central Arctic, where temperature anomalies exceeded +3°C, but temperatures were nearer average near the East Siberian coast (Figure 4a).
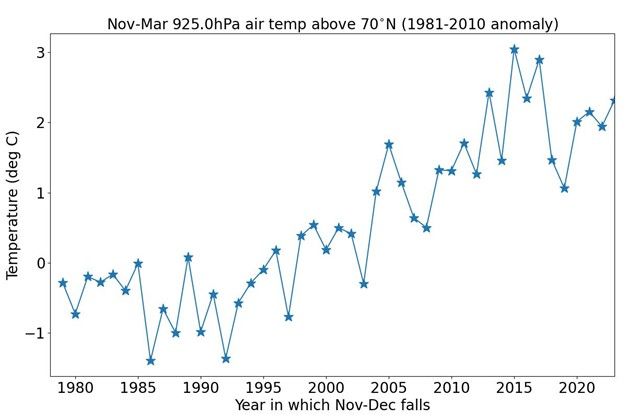
Figure 3. Average November-March air temperature (°C) at 925 hPa for the region north of 70 °N from 1970-present, according to the ERA5 reanalysis (Hersbach et al., 2017).
The regional differences can be explained by the prevailing weather patterns: throughout the winter pressure tended to be unusually high over Greenland, and low over the Siberian Arctic, directing warm air from midlatitudes over the Canadian and Central Arctic while the East Siberian Sea often received northerly airstreams from the Central Arctic Ocean where temperatures are colder (Figure 4b).
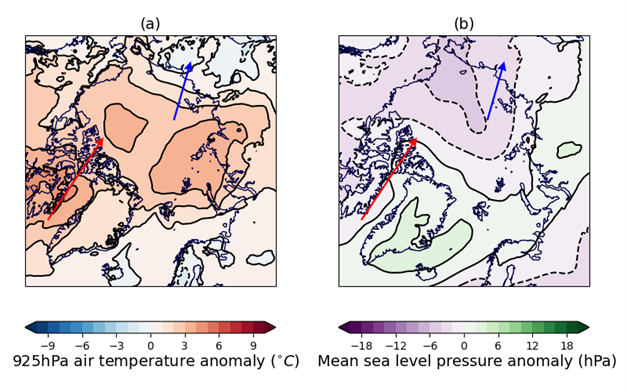
Figure 4. Near-surface Arctic weather conditions for November 2023 – March 2024 relative to the 1981-2010 long-term average: (a) 925 hPa air temperature anomaly (°C); (b) mean sea level pressure anomaly (hPa). Data are from the ERA5 reanalysis (Hersbach et al., 2017). The main directions of warm (red) and cold (blue) air movement are indicated by arrows.
Sea ice thickness at the end of winter can influence summer sea ice melt, with ice thicker than 2m thought to be more likely to survive the melt season (Keen et al., 2013). The CryoSat-2 radar altimeter has measured sea ice thickness over nearly the whole Arctic Ocean since 2010 (Tilling et al., 2018). According to this dataset, sea ice in March 2024 was thicker than the 2011-2023 average in the Siberian Arctic and in the Transpolar Drift region between the North Pole and the Fram Strait, but was thinner than average in the Beaufort Sea and Canada Basin (Figure 5a). This is supported by estimates from the PIOMAS forced ice-ocean model (Schweiger et al., 2011), which shows a similar pattern albeit with smaller anomalies (Figure 5b). Both data sources show a substantial area of ice thicker than 2m between the North Pole, the Fram Strait and the Beaufort Sea, and a smaller area in the East Siberian Sea.
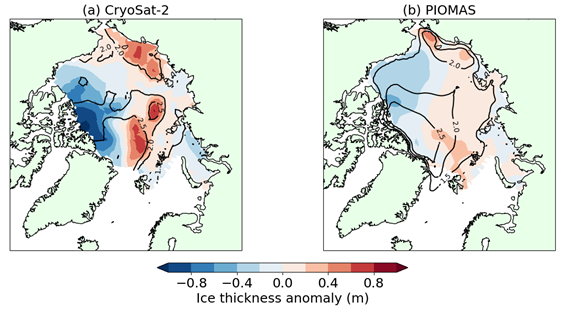
Figure 5. March 2024 ice thickness anomaly, relative to the 2011-2023 average, as estimated by (a) CryoSat-2 satellite radar altimetry; (b) the PIOMAS forced ice-ocean model. Contour lines of sea ice thickness are shown for both datasets.
April and May have been less anomalously mild than the extended winter, with near- or below-average temperatures observed over large parts of the Arctic Ocean. Stormy and settled conditions alternated frequently, but southerly winds were quite rare across most of the Arctic, with air tending to circulate within the Arctic Ocean instead. Since late May, conditions have been warmer, with substantial warm air outbreaks occurring in the Beaufort and Laptev Seas in particular.
Consistent with the cool conditions, sea ice loss so far in 2024 was unexceptional up until the start of June. May sea ice extent was 12.78 million sq km, 0.51 million sq km below the 1981-2010 average but 0.48 million sq km above the long-term linear trend (Figure 6). The rate of ice loss for May was near average at 49,000 sq km per day. This does not preclude more severe ice loss during the summer; the average sea ice extent for May 2012 was even higher, but preceded the lowest September extent on record. Notably, sea ice loss for June so far has been well above average.

Figure 6. Average May Arctic sea ice extent according to the NSIDC Sea Ice Index (Fetterer et al., 2017) with 1979-2023 linear fit and 1981-2010 mean indicated.
Outlook for September
There is no significant correlation between ice extent in early June and the seasonal minimum extent in September, as the severity of melt is heavily dependent on Arctic weather conditions over the summer. Statistical predictions based on daily ice extent only start to achieve some skill by mid-July. Hence it is not possible to predict September sea ice extent with any confidence at this point in the season. The very mild winter may have made severe sea ice melt more likely, while the cooler spring could have had the opposite effect by delaying melt onset. However, either of these factors could be overwhelmed by summer weather conditions due to the very strong influence of these on sea ice melt.
Antarctic
Sea ice state
Antarctic sea ice extent on 7th June 2024 was 11.22 million sq km (Figure 7) according to data from the National Snow and Ice Data Center (NSIDC). This was 1.59 million sq km below the 1991-2020 average, and was the 2nd lowest extent on record for this date, with only the record low extent of 10.60 million sq km in 2023 having been lower.
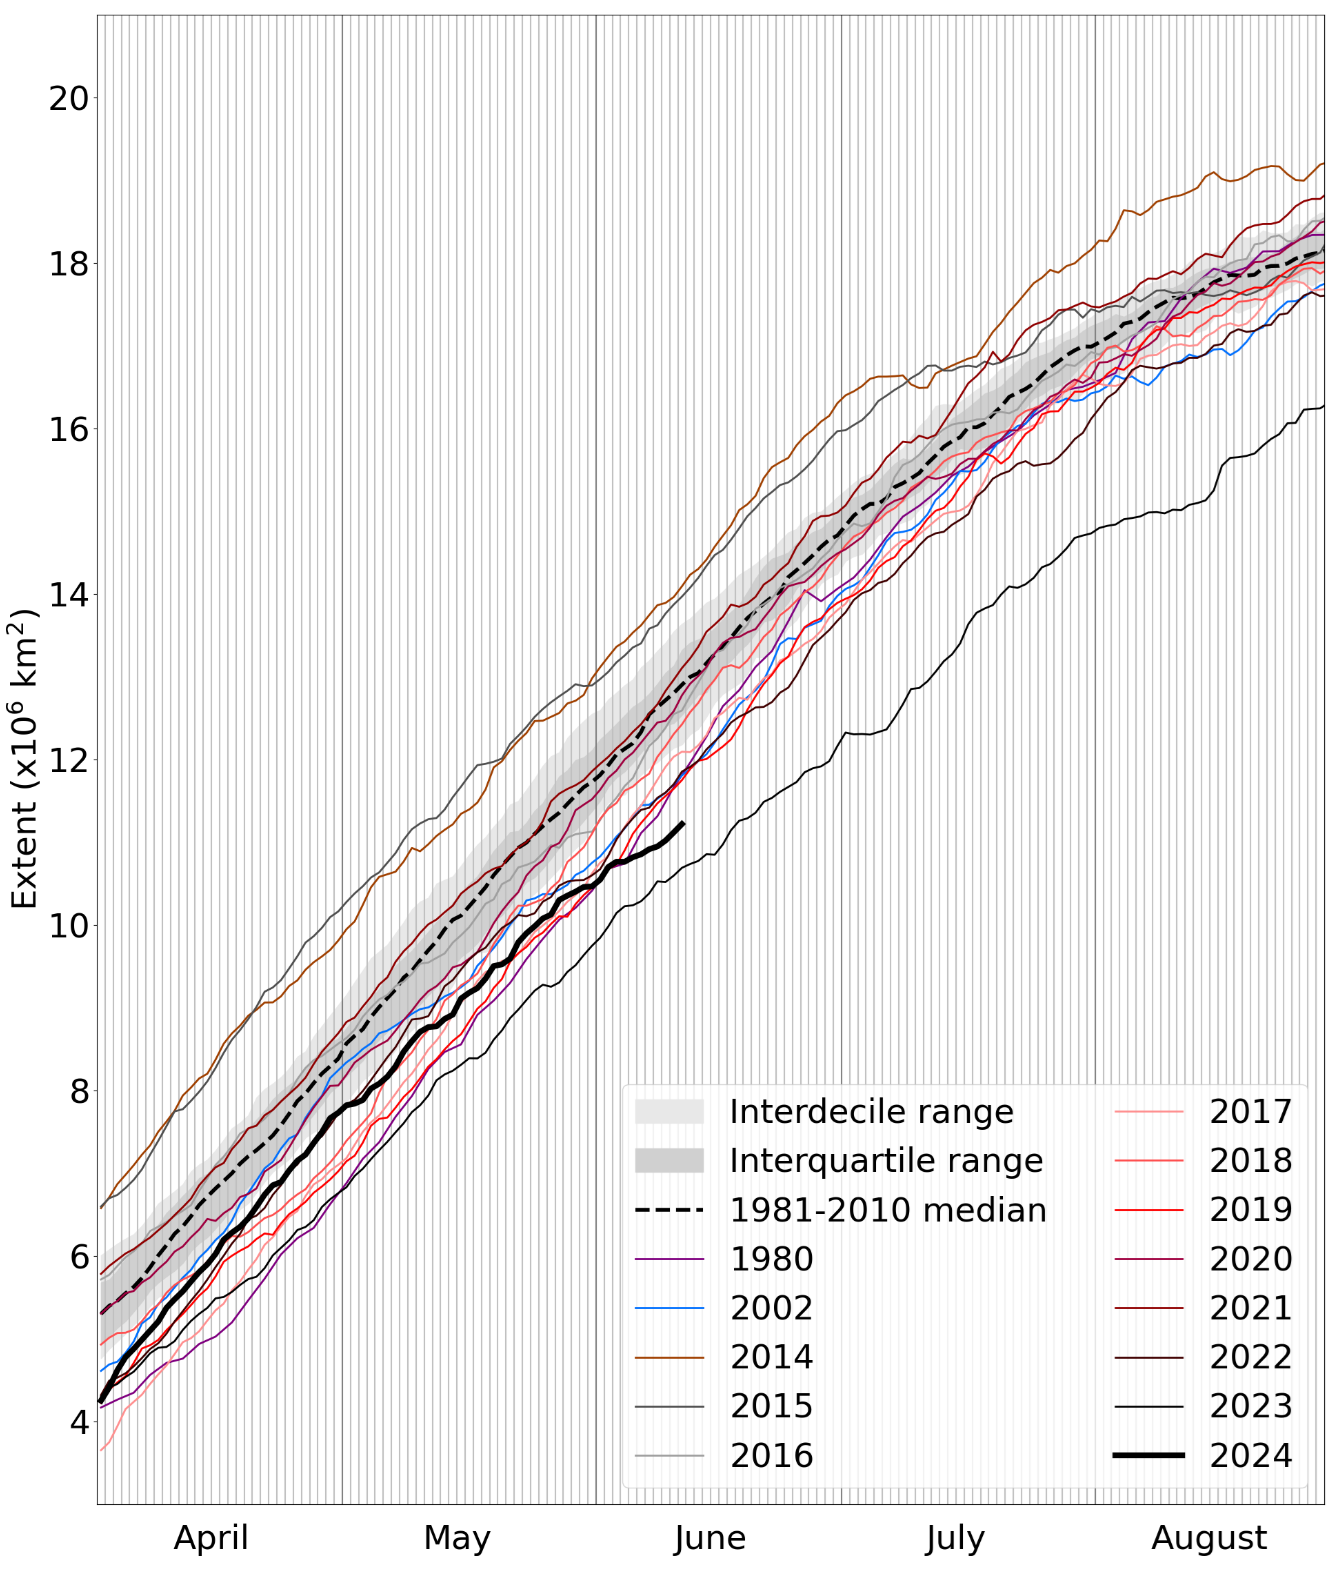
Figure 7.Daily Antarctic sea ice extent for 2024, compared with recent years and the low ice years of 1980, 1986 and 2002. Also shown is the 1981-2010 average with interquartile and interdecile ranges shown by the shaded areas. Data are from the National Snow and Ice Data Center (NSIDC).
Extent was well below average in the eastern Weddell Sea, the eastern Ross Sea, and the Amundsen Sea, and slightly below average in the Indian Ocean sector. Extent was slightly above average in the western Weddell Sea, the western Ross Sea and the Bellingshausen Sea (Figure 8). This pattern contrasts sharply with that observed during the exceptionally low sea ice period of June-September 2023, when the Amundsen Sea was the only region consistently showing above-average ice extent.
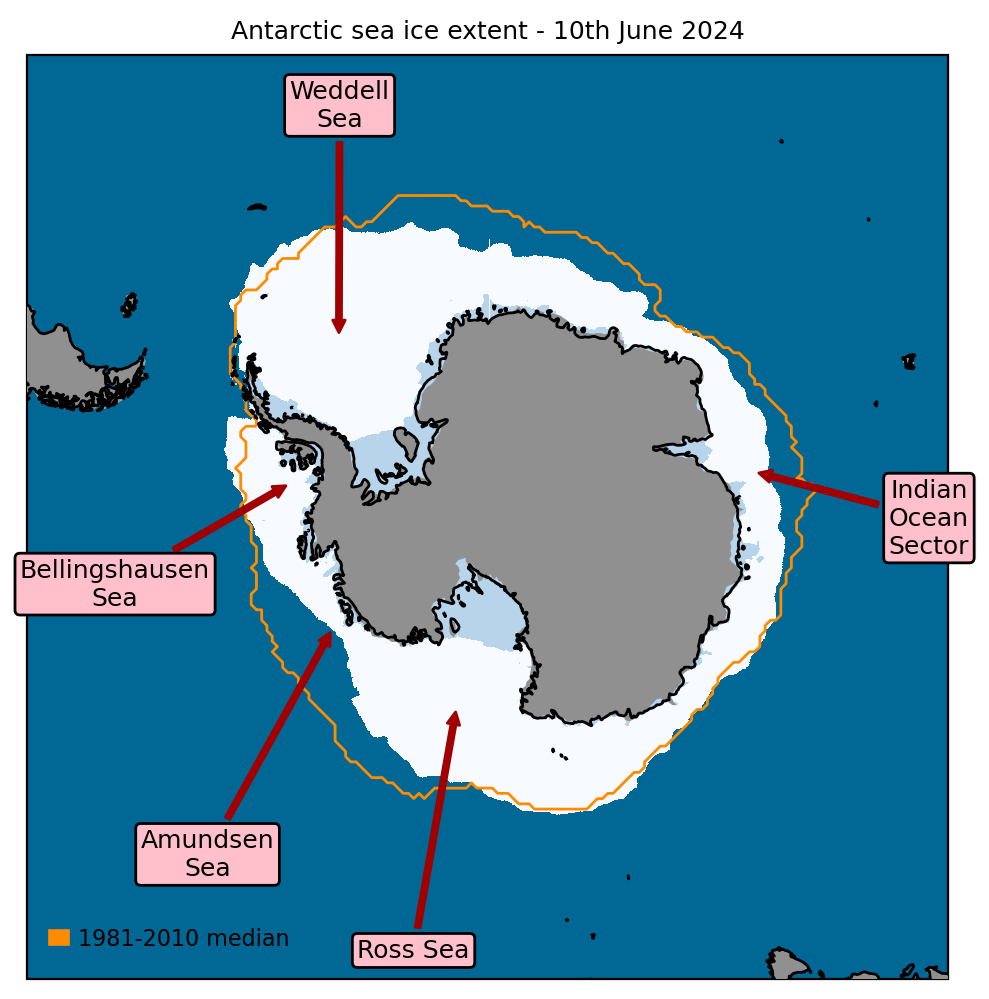
Figure 8. Antarctic sea ice extent on 10th June 2024, with 1981-2010 average extent indicated in orange, and with regions referred to in the text labelled. Data are from EUMETSAT OSI SAF (Tonboe et al., 2017).
Antarctic conditions in context
Antarctic weather conditions over 2024 so far, and particularly April-May, have been characterised by a large triangular region of lower-than-average pressure over the Southern Ocean and Antarctica, with particularly low pressure in the Weddell Sea, Ross Sea & Indian Ocean sectors, interspersed with regions of higher pressure (Figure 9a). Warm northerly winds tend to blow to the right of high-pressure systems in the Southern Hemisphere; the locations of these correspond closely with above-average temperatures (Figure 9b) and with the areas of below-average extent in Figure 8.
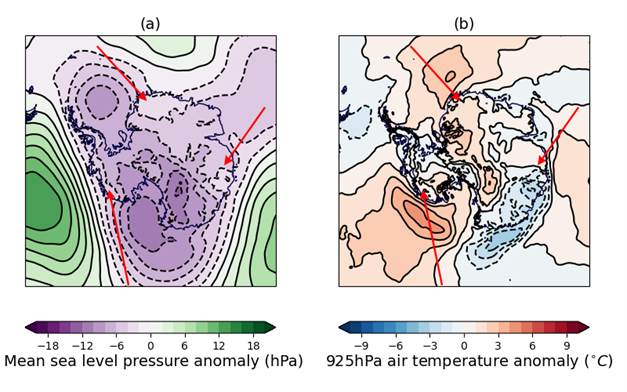
Figure 9. Near-surface Antarctic weather conditions for April-May 2024 relative to the 1981-2010 long-term average: (a) mean sea level pressure anomaly (hPa); (b) 925 hPa air temperature anomaly (°C). Data are from the ERA5 reanalysis (Hersbach et al., 2017). The main areas of warm air movement are indicated with red arrows.
This three-wave pattern around Antarctica has been very common in recent years (Schroeter et al., 2023), causing increased exchange of warm air with midlatitudes. It was implicated in last year’s record low extent (Ionita, 2024), although oceanic warming is also thought to be responsible for some of the recent ice loss (Purich & Doddridge, 2023).
Regularly updated indices of sea ice extent anomaly are available on the Met Office Climate Dashboard.
References
Fetterer, F., K. Knowles, W.N. Meier, M. Savoie and A.K. Windnagel (2017) Sea Ice Index, Version 3. Boulder, Colorado USA. National Snow and Ice Data Center. https://doi.org/10.7265/N5K072F8. Date Accessed: 04-06-2024
Hersbach, H. et al. (2017) Complete ERA5 from 1940: Fifth generation of ECMWF atmospheric reanalyses of the global climate. Copernicus Climate Change Service (C3S) Data Store (CDS). https://doi.org/10.24381/cds.143582cf (Accessed on 11-06-2024)
Ionita,M. (2024) Large-scale drivers of the exceptionally low winter Antarctic sea ice extent in 2023. Front. Earth Sci.12, 1333706. https://doi.org/10.3389/feart.2024.1333706
Keen, A.B., H.T. Hewitt and J.K. Ridley (2013) A case study of a modelled episode of low Arctic sea ice. Clim. Dyn., 41, 1229–1244. https://doi.org/10.1007/s00382-013-1679-y
Purich, A. and E.W. Doddridge (2023) Record low Antarctic sea ice coverage indicates a new sea ice state. Commun. Earth Environ., 4, 314. https://doi.org/10.1038/s43247-023-00961-9
Schroeter, S., T.J. O'Kane and P.A. Sandery (2023) Antarctic sea ice regime shift associated with decreasing zonal symmetry in the Southern Annular Mode. Cryosphere, 17, 701–717. https://doi.org/10.5194/tc-17-701-2023
Schweiger, A., R. Lindsay, J. Zhang, M. Steele, H. Stern and R. Kwok (2011) Uncertainty of modelled arctic sea ice volume. J. Geophys. Res. Oceans, 116, C00D06. https://doi.org/10.1029/2011JC007084
Tilling, R.L., A. Ridout and A. Shepherd (2018) Estimating Arctic sea ice thickness and volume using CryoSat-2 radar altimeter data. Adv. Space Res., 62, 1203–1225. https://doi.org/10.1016/j.asr.2017.10.051
Tonboe, R., J. Lavelle, R.-H. Pfeiffer and E. Howe (2017) OSI SAF Global Sea Ice Concentration. Product OSI-401-b. Version 1.6. September 2017, Available at: https://osi-saf.eumetsat.int/products/osi-401-b