

Briefing on Arctic and Antarctic sea ice - July 2024
Alex West and Ed Blockley
Summary
- Following a warm June, Arctic sea ice extent is below average for the time of year but some way above record low levels, with conditions fairly typical of recent years.
- Extent is particularly low in the Laptev Sea and in the Atlantic sector, but nearer average in other parts of the Arctic.
- This year’s September Arctic sea ice extent is likely to be well below average, but there are not yet heightened indications of a new record low.
- Antarctic sea ice extent is very low, albeit higher than last year’s record low extent.
Arctic
Arctic sea ice state
Arctic sea ice extent on 8th July 2024 was 8.81 million sq km. This was 1.36 million sq km below the 1981-2010 average, but was 0.60 million sq km above the record low for this date, which occurred in 2020 (Figure 1).
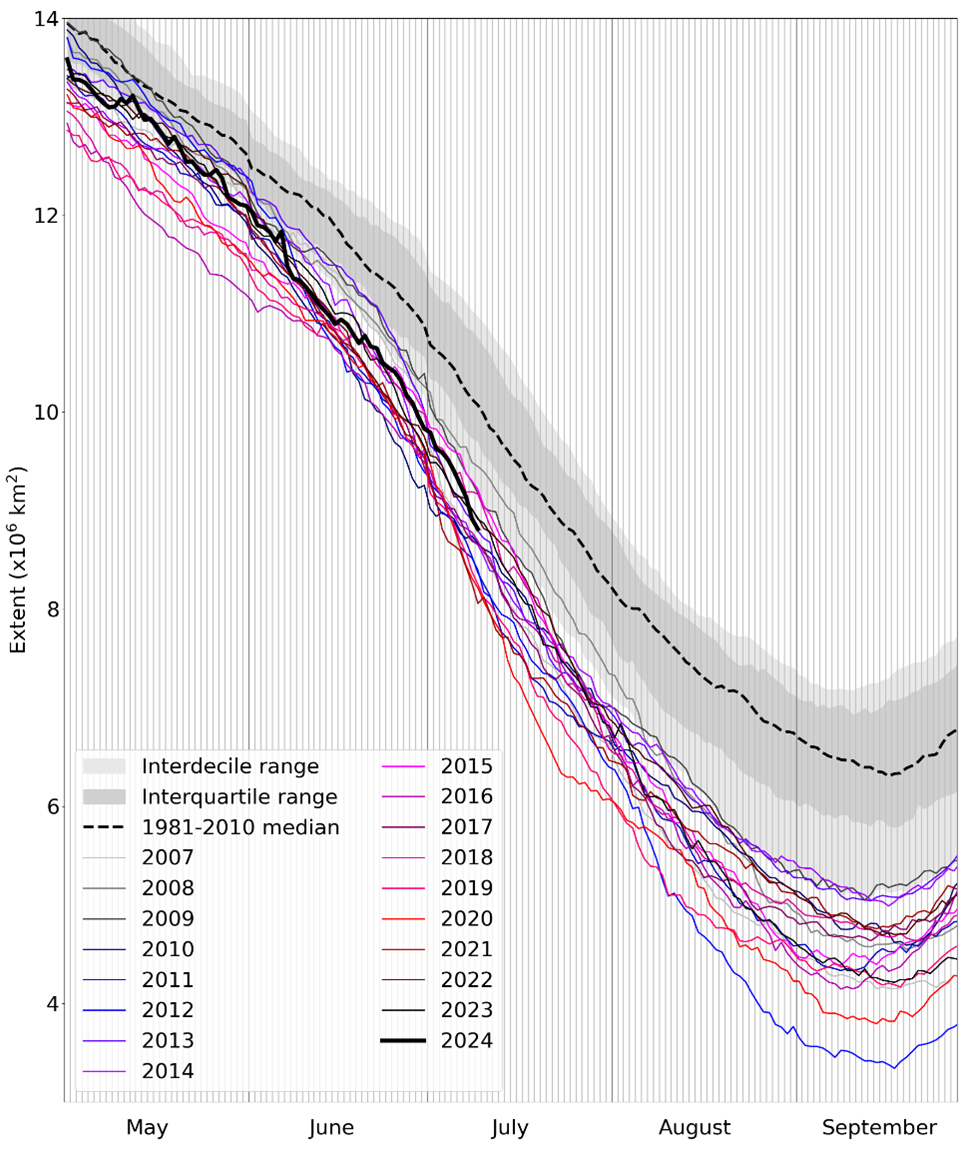
Figure 1. Daily Arctic sea ice extent for 2024, compared with recent years and the 1981-2010 average, with interquartile and interdecile ranges indicated by the shaded areas. Data are from the National Snow and Ice Data Center (NSIDC).
Extent was well below average in most parts of the Arctic, particularly in the Laptev Sea north of Siberia, and in the Barents Sea bordering the North Atlantic. However, ice extent was near average in the Chukchi Sea, the central Arctic Ocean and the East Siberian Sea.
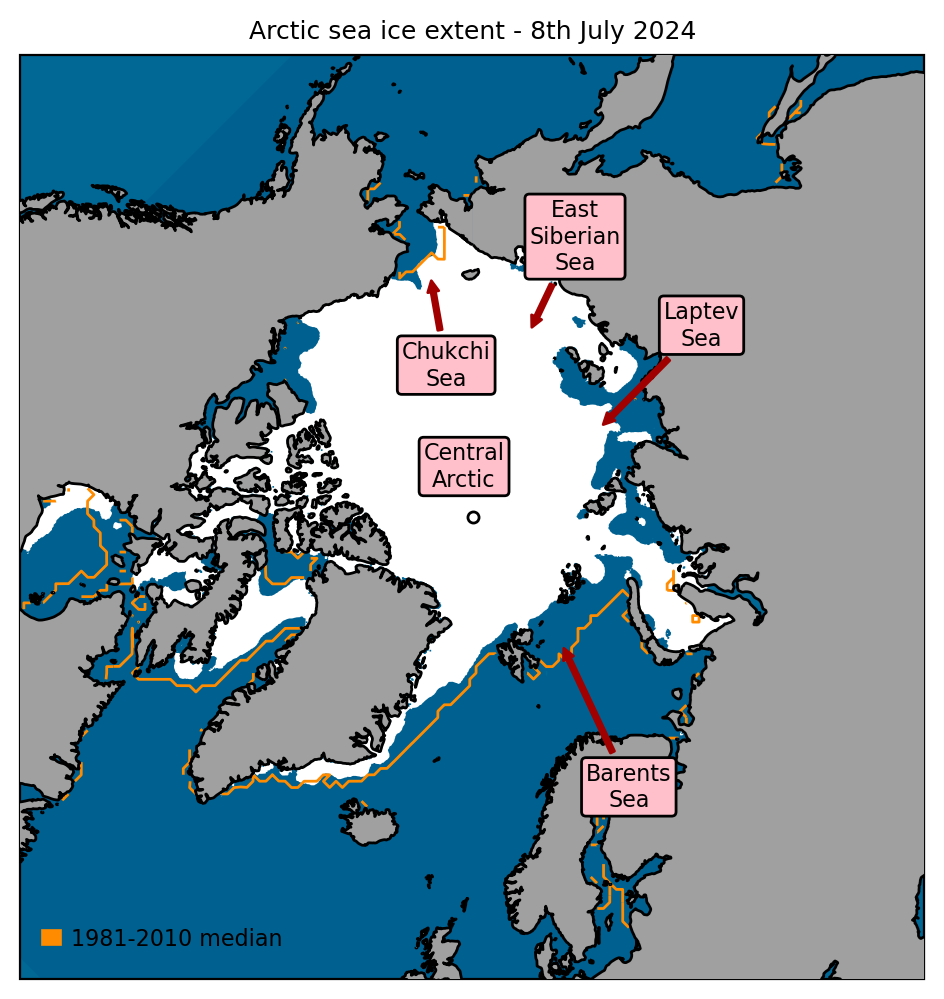
Figure 2. Arctic sea ice extent on 8th July 2024, with 1981-2010 average extent indicated in orange, and the regions referred to in the text labelled. Data are from EUMETSAT OSI SAF (Tonboe et al., 2017).
Arctic: June 2024 in context
Arctic sea ice extent for June 2024 was 10.90 million sq km. This was 0.87 million sq km below the 1981-2010 average and 0.40 million sq km above the long-term linear trend (Figure 3). The average rate of ice loss for the month was 75,000 sq km / day, above the 1981-2010 average of 59,000 sq km / day.
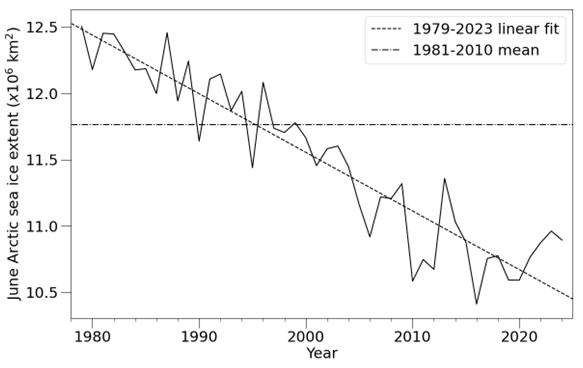
Figure 3. Time series of June Arctic sea ice extent according to the NSIDC Sea Ice Index (Fetterer et al., 2017), with 1981-2010 average and 1979-2023 linear trend indicated.
The month was quite warm and settled in the central Arctic, with a persistent high-pressure ridge extending from eastern Siberia into the Arctic Ocean (Figure 4a). To the west of the high pressure, frequent southerly winds brought particularly warm conditions to the Laptev Sea (Figure 4b), where open water was particularly extensive by the end of the month; to its east, northerly winds brought cooler conditions to the Chukchi and East Siberian seas. On the other side of the Arctic, the Atlantic ice edge saw stormier, more unsettled conditions.
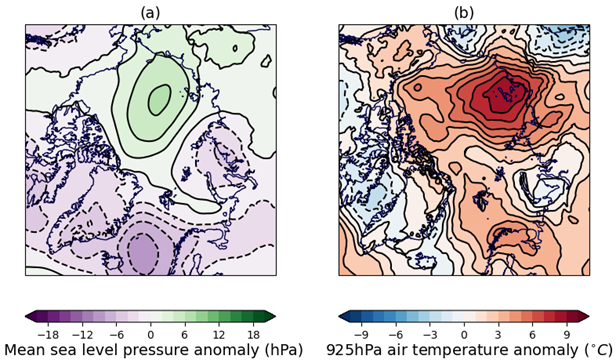
Figure 4. June 2024 anomaly relative to the 1981-2010 average in (a) sea level pressure; (b) 925hPa temperature. Sea level pressure and temperature data are from the ERA5 reanalysis (Hersbach et al., 2017).
Outlook for September
Uncertainty in predictions of September Arctic sea ice extent is still very high at the time of writing, as Arctic weather has a strong influence on sea ice melt for the remainder of the melt season. There are no indications yet that this summer is particularly likely to see a new record low September extent. However, it is very likely that this summer’s September extent will be lower than any recorded prior to 2007, as has been the case for all years since 2007.
Each year, the Sea Ice Outlook collates predictions of September Arctic sea ice extent from scientific centres around the world in a series of reports published in June, July, August and September. This year, 27 predictions were submitted for the June report, ranging from 3.1 to 5.21 million sq km, with a median of 4.48 million sq km and an interquartile range of 4.21 to 4.74 million sq km. Predictions from dynamical models are mostly lower than predictions from statistical or machine-learning methods.
To supplement the Sea Ice Outlook predictions, we make two statistical predictions of September extent, using two different methods:
- There is some correlation between September average ice extent and average ice extent from 24th June – 8th July (the most recent 15 days of available data at the time of writing). Applying standard statistical methods to this relationship produces a September average extent of 4.71 ± 0.83 million sq km. This is consistent with a September extent in the range of the 2nd – 19th lowest.
- We can also extrapolate the sea ice extent on 8th July by subtracting the daily melting rates observed in the years 2007-2022 from now until September. This method produces a range of September sea ice extents from 4.08 to 5.54 million sq km, consistent with a September extent in the range 3rd – 19th lowest.
The various predictions are summarised in Figure 5.
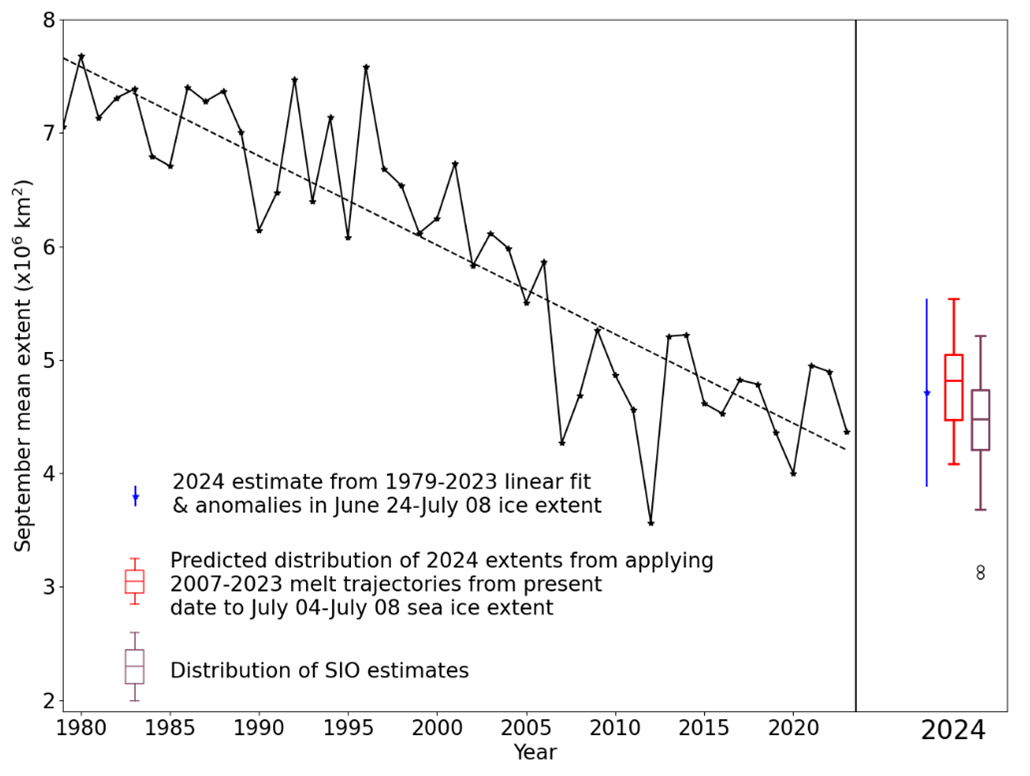
Figure 5. September Arctic sea ice extent since satellite records began in 1979 from the NSIDC Sea Ice Index (Fetterer et al., 2017), with SIPN Sea Ice Outlook and statistical predictions for September 2024. For the statistical prediction derived from linear fit, error bars represent twice the standard deviation of September mean ice extent about the trend lines with respect to which the estimates are taken. The range of predictions derived from past melting trajectories is shown as a red boxplot indicating range, median and quartiles of estimates derived from each trajectory in the 2007-2023 period. The Sea Ice Outlook is shown as a purple boxplot indicating range, median and quartiles of the 27 predictions submitted.
Antarctic
Antarctic sea ice state
Antarctic sea ice extent on 8th July 2024 was 13.76 million sq km (Figure 6). This was 1.59 million sq km below the 1981-2010 average, and was the second-lowest extent for this date in the satellite era, the lowest having been 12.67 million sq km, recorded last year (2023) during a prolonged period of exceptionally low extent.
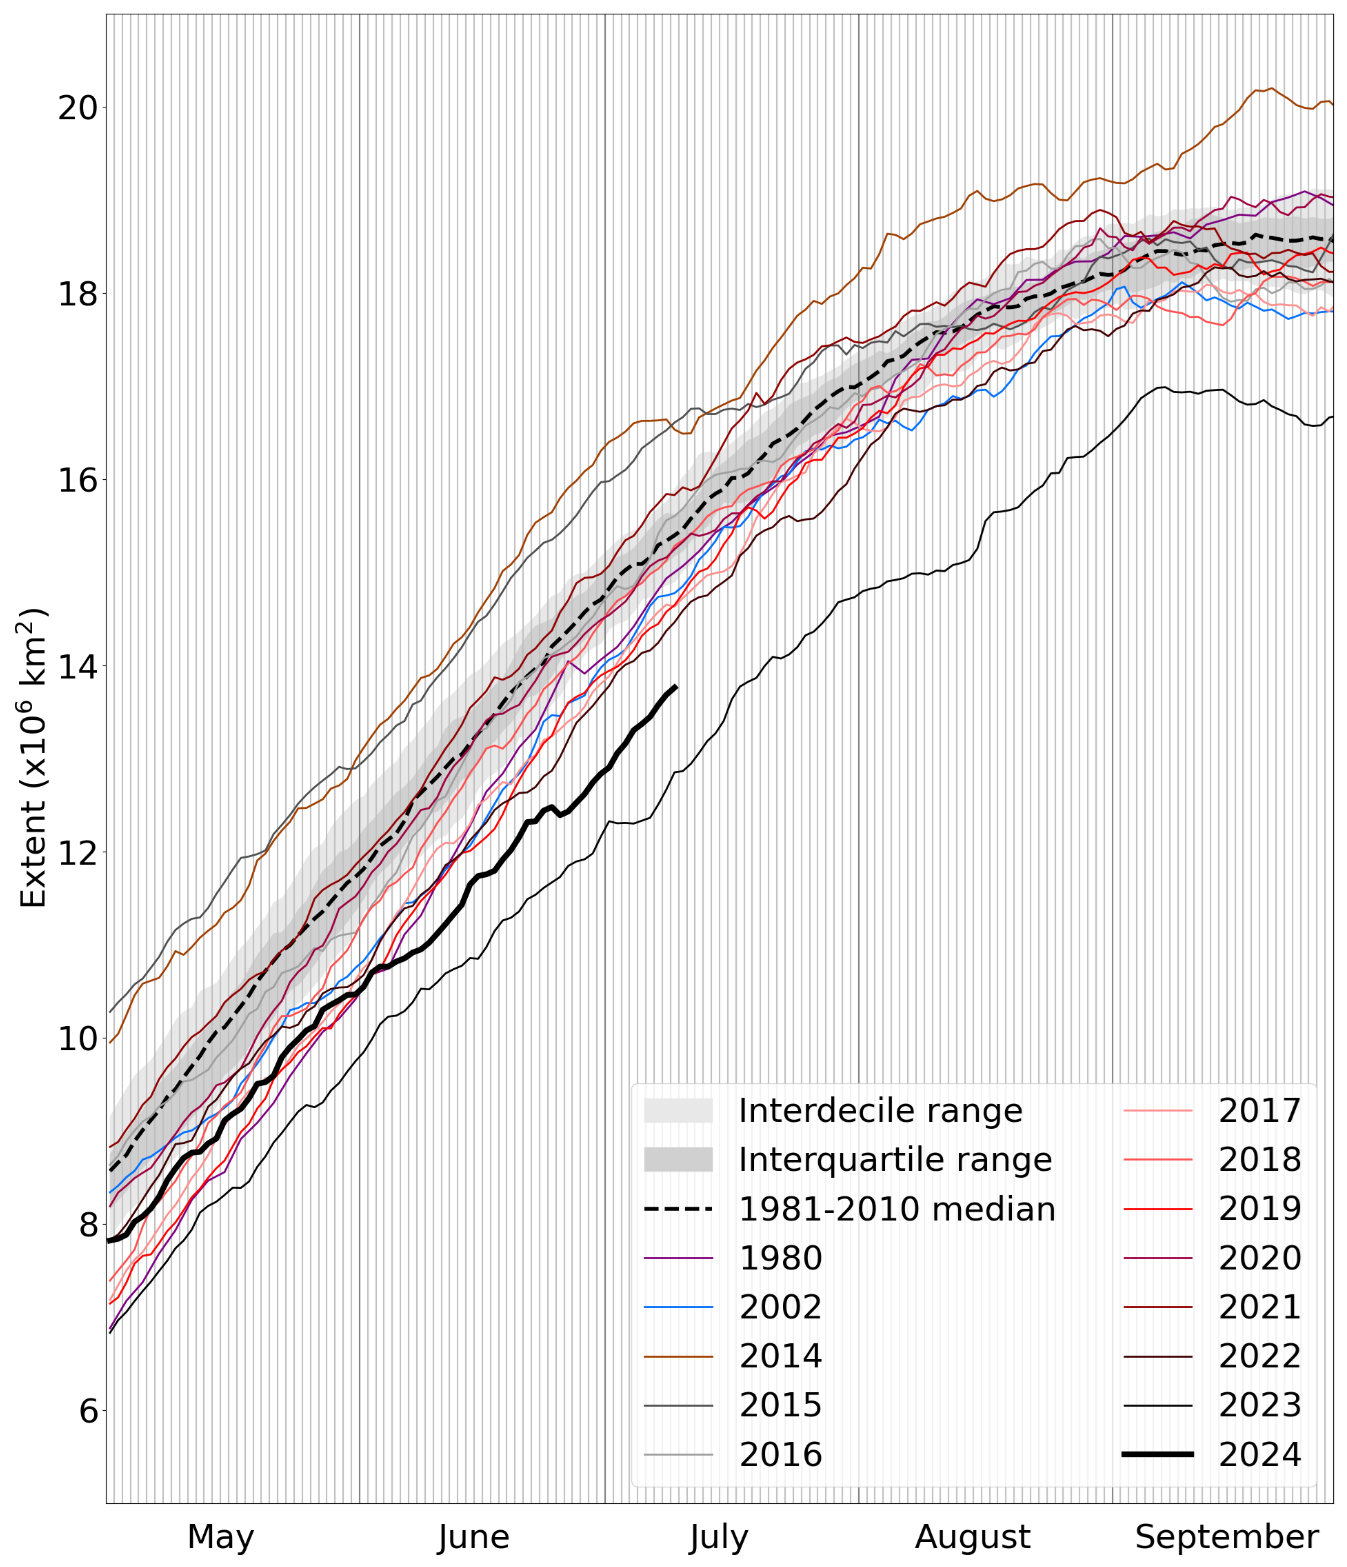
Figure 6. Daily Antarctic sea ice extent for 2024, compared with recent years, selected historic years with low ice cover, and the 1981-2010 average, with interquartile and interdecile ranges indicated by the shaded areas. Data are from NSIDC.
Extent was well below average in all regions of the Antarctic except in parts of the Ross Sea and eastern Indian Ocean sector, where it was near-average, and in the western Weddell Sea, where it was above average (Figure 7).
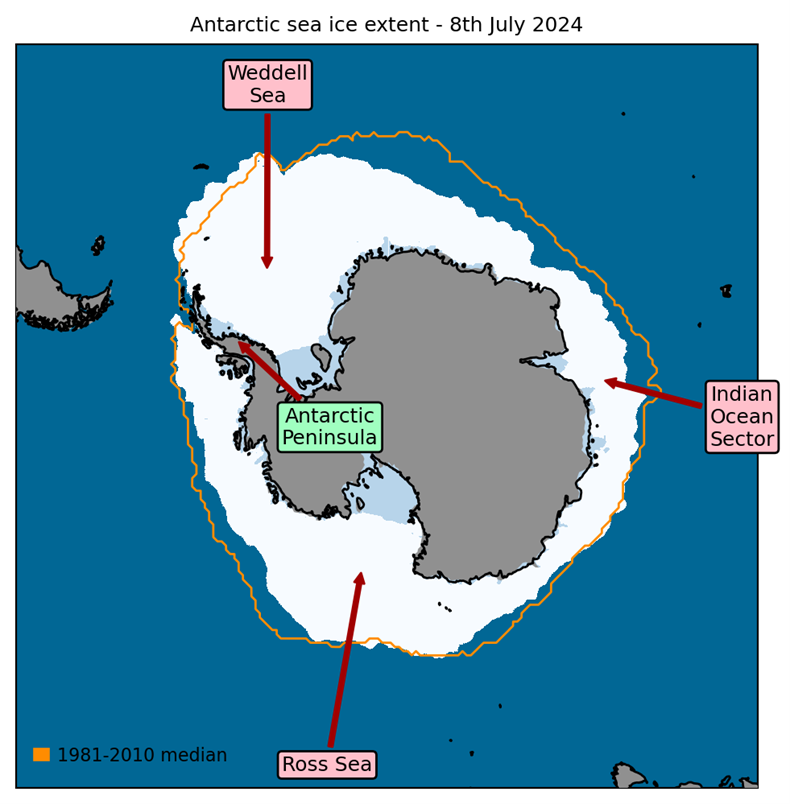
Figure 7. Antarctic sea ice extent on 8th July 2024, with 1981-2010 average extent indicated in orange, and the regions referred to in the text labelled. Data are from EUMETSAT OSI SAF (Tonboe et al., 2017).
Antarctic: June 2024 in context
The current low Antarctic sea ice extent continues a period of very prolonged below-average extent that began in early 2021, with two successive record low summer minima observed in 2022 and 2023, followed by exceptionally slow growth and a record low winter maximum from May-October 2023. While not as low as last year, the current extent would otherwise have represented a new record low by a considerable margin and represents ice growth much slower than the 1981-2010 average.
The very low Antarctic sea ice extent has been attributed to increased upwelling of warm waters, as well as increased heat exchange with lower latitudes. In June 2024, the prevailing weather pattern was not as meridional as previous months: fewer locations on the ice edge saw prolonged warm northerly winds. However, persistent warm northerly and cold southerly winds prevailed near the Antarctic Peninsula and in the eastern Weddell Sea respectively, consistent with the locations of the most striking sea ice extent anomalies.
References
Fetterer, F., K. Knowles, W.N. Meier, M. Savoie and A.K. Windnagel (2017) Sea Ice Index, Version 3. Boulder, Colorado USA. National Snow and Ice Data Center. https://doi.org/10.7265/N5K072F8. Date Accessed: 03-07-2023.
Hersbach, H. et al. (2017) Complete ERA5 from 1940: Fifth generation of ECMWF atmospheric reanalyses of the global climate. Copernicus Climate Change Service (C3S) Data Store (CDS). https://doi.org/10.24381/cds.143582cf (Accessed on 08-07-2024)
Tonboe, R., J. Lavelle, R.-H. Pfeiffer and E. Howe (2017) OSI SAF Global Sea Ice Concentration. Product OSI-401-b. Version 1.6. September 2017, Available at: https://osi-saf.eumetsat.int/products/osi-401-b