

Briefing on Arctic and Antarctic sea ice - August 2024
Alex West and Ed Blockley
Summary
- Arctic sea ice extent is currently 3rd lowest on record for the time of year, following record high ice loss during July. Extent is very low everywhere except in the Chukchi and East Siberian seas.
- This year is likely to see Arctic September extent in the lower or middle part of the range for the post-2007 climate. A new record low extent remains a possibility.
- Antarctic sea ice extent remains 2nd lowest on record for the time of year, although at the end of July it was briefly very close to last year’s record-breaking low extent.
Arctic
Arctic sea ice state
Arctic sea ice extent on 7th August 2024 was 5.61 million sq km (Figure 1). This was the 3rd lowest extent in the satellite record (since 1979) for this date, the lowest having been 5.39 million sq km in 2019. This year’s extent was 2.06 million sq km below the 1981-2010 average.
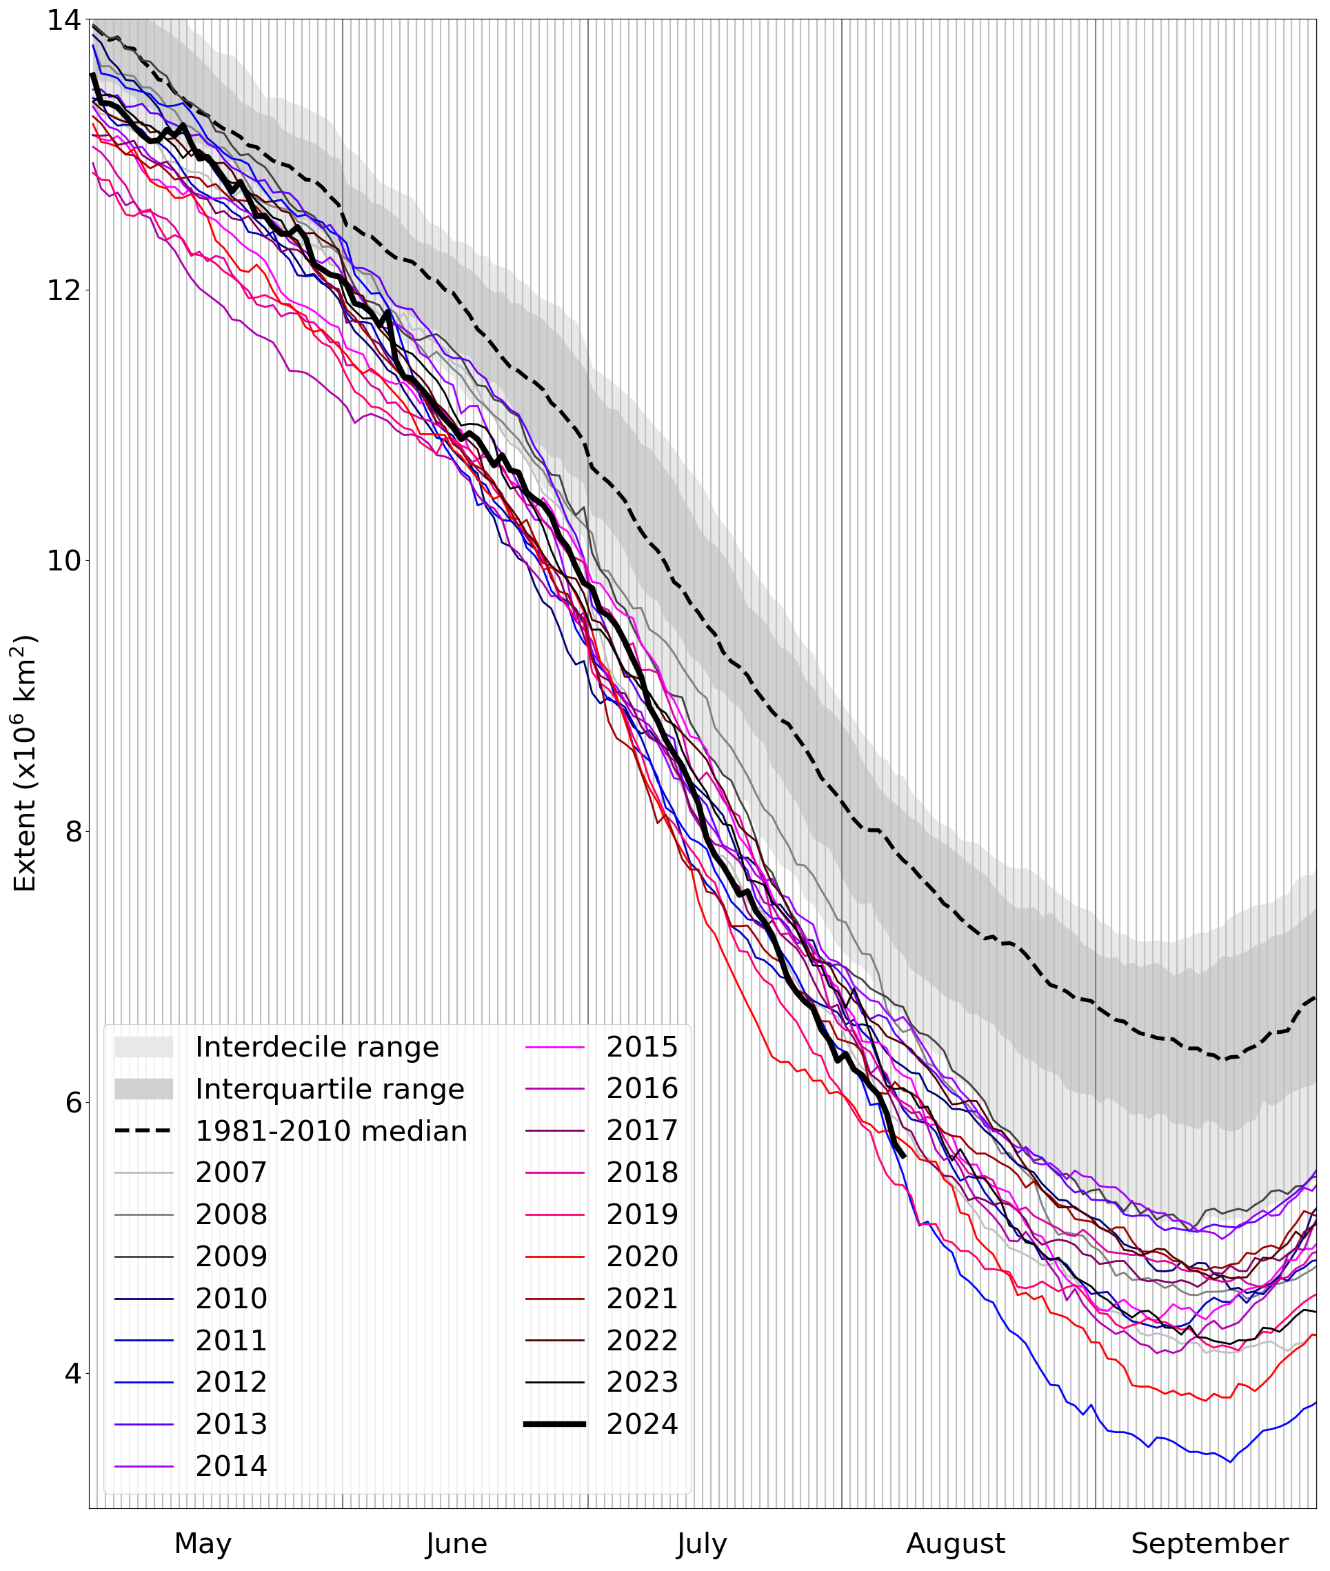
Figure 1. Daily Arctic sea ice extent for 2024, compared with recent years and the 1981-2010 average, with interquartile and interdecile ranges indicated by the shaded areas. Data are from the National Snow and Ice Data Center (NSIDC).
Extent was well below average throughout the Arctic except in parts of the Chukchi and East Siberian seas, where it was nearer average (Figure 2); a small region of the western Chukchi Sea saw above-average extent.
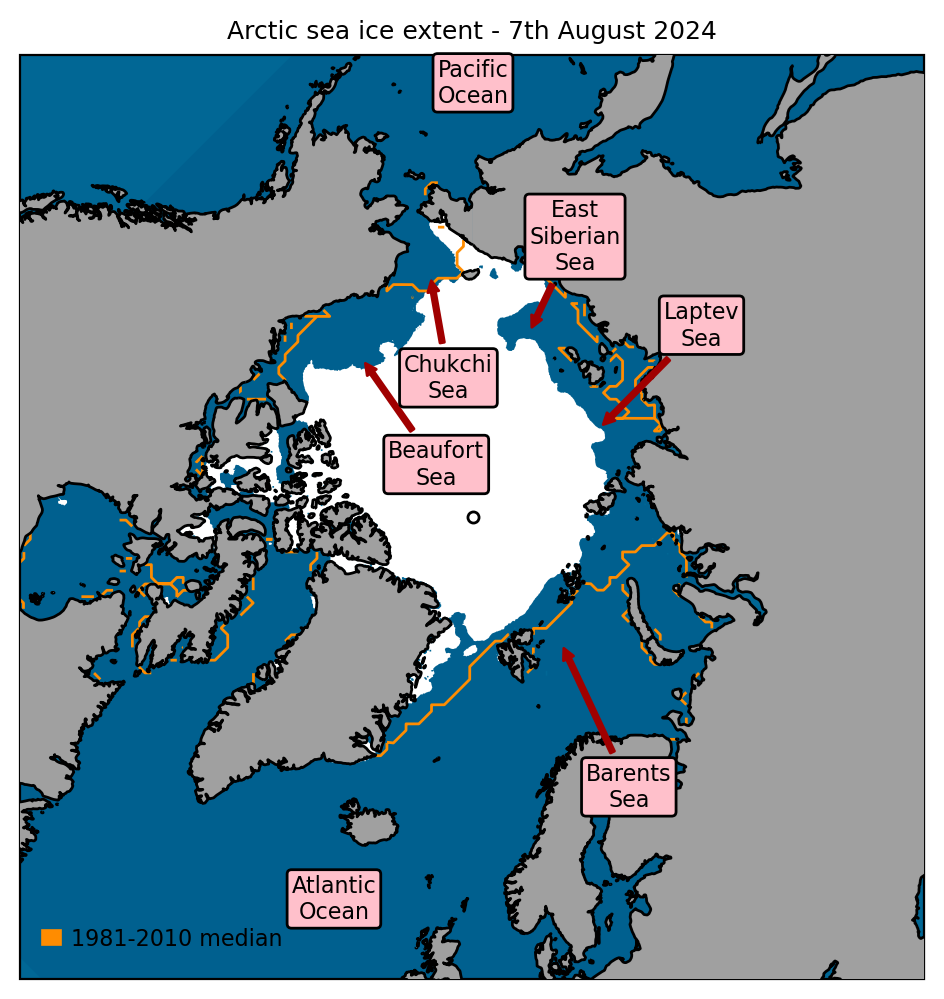
Figure 2. Arctic sea ice extent on 7th August 2024, with 1981-2010 average extent indicated in orange, and the regions referred to in the text labelled. Data are from EUMETSAT OSI SAF (Tonboe et al., 2017).
Arctic: July 2024 in context
The average rate of sea ice loss during July 2024 was 110,000 sq km per day, the joint fastest on record (with July 2020). This compares to a 1981-2010 average July ice loss of 86,000 sq km per day.
Average Arctic sea ice extent for July 2024 was 7.89 million sq km according to the NSIDC Sea Ice Index (Fetterer et al., 2017). This was 1.58 million sq km below the 1981-2010 average and 0.36 million sq km above the long-term linear trend (Figure 3). It was the 6th lowest July extent since satellite records began in 1979.
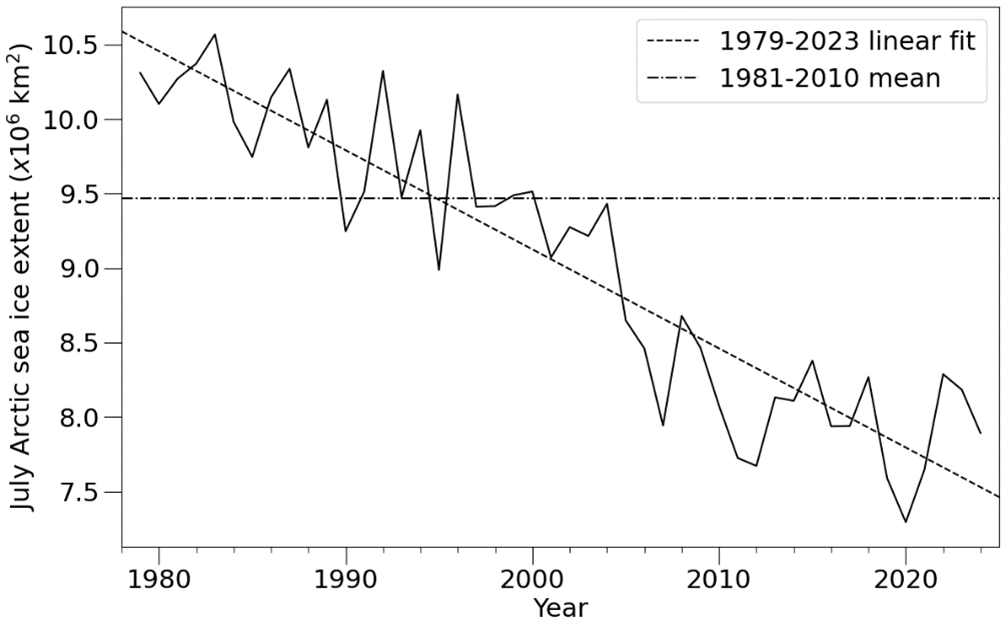
Figure 3. Time series of July Arctic sea ice extent according to the NSIDC Sea Ice Index (Fetterer et al., 2017), with 1981-2010 average and 1979-2023 linear trend indicated.
July Arctic weather saw winds mainly blowing from the Atlantic to the Pacific side of the Arctic, due to persistent high-pressure ridges over Western and Central Siberia and stormy, cyclonic conditions over the North American Arctic (Figure 4a). The Atlantic sector of the Arctic, together with most of the Siberian coastal seas (Kara and Laptev), saw warmer than average temperatures due to frequent southerly winds (Figure 4b). However, the Pacific sector of the Arctic, notably the Beaufort, Chukchi and East Siberian Seas, were cooler than average, often experiencing northerly winds from the Central Arctic, explaining the muted sea ice loss in much of this area.
The weather pattern of July is similar to the negative phase of the Arctic Dipole. This is noteworthy, because in the past, severe sea ice loss has often been associated with the reverse pattern (the positive phase of the Arctic Dipole), with winds mainly blowing from the Pacific to the Atlantic. This underlines the unpredictability of Arctic sea ice extent, showing that rapid sea ice loss is possible under a variety of Arctic weather patterns.
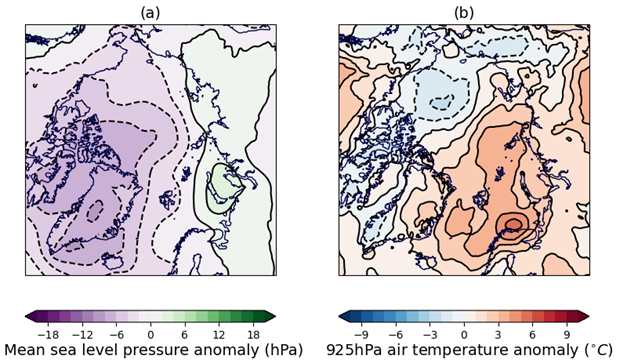
Figure 4. July 2024 anomaly relative to the 1981-2010 average in (a) sea level pressure; (b) 925hPa temperature. Sea level pressure and temperature data are from the ERA5 reanalysis (Hersbach et al., 2017).
Since the end of July, the rate of ice loss has remained well above the 1981-2010 average, despite a period of cool, cyclonic conditions across the Arctic Ocean at the start of the month.
Outlook for September
Following the very rapid ice loss during July, it is all but certain that September 2024 will see a continuation of the low September extents that have marked the post-2007 period; extent since 2007 has been between 3.56 to 5.26 million sq km, compared to 5.50 to 7.68 million sq km for the pre-2007 period. It is unlikely that September 2024 ice extent will be high even compared to the lower extent in the post-2007 climate, with an extent in the middle or lower end of the range much more likely. A new record low this year remains possible; the current record low September Arctic sea ice extent was set in 2012, at 3.57 million sq km.
Each year, the Sea Ice Outlook collates predictions of September Arctic sea ice extent from scientific centres around the world in a series of reports published in June, July, August and September. This year, 22 predictions were submitted for the July report, ranging from 3.4 to 5.21 million sq km, with a median of 4.45 million sq km and an interquartile range of 4.17 to 4.76 million sq km. This is a very similar distribution to that of the June report and encompasses the full range of September extents observed in the post-2007 climate.
Notably, central predictions from dynamical models (range 3.4 to 4.21 million sq km, roughly equivalent to the lower half of the post-2007 range) were universally lower than those from statistical or machine learning methods (range 4.34 to 5.21 million sq km, equivalent to the upper half of the post-2007 range).
To supplement the Sea Ice Outlook predictions, we make two statistical predictions of September extent, using two different methods:
- There is good correlation between September average ice extent and average ice extent from 24th July – 7th August (the most recent 15 days of available data at the time of writing). Applying standard statistical methods to this relationship produces a September average extent of 4.24 ± 0.59 million sq km. This is consistent with a September extent in the range of 2nd – 12th lowest. The range indicates that an extent close to the highest years of the post-2007 climate (2009, 2013 and 2014) is very unlikely. The lower bound (3.63 million sq km) is very close to the 2012 record low.
- We also extrapolate the sea ice extent on 7th August by subtracting the daily melting rates observed in the years 2007-2023 from now until September. This produces a range of 3.68 to 4.68 million sq km, consistent with a September extent in the range 2nd – joint-9th lowest, the lower half of the post-2007 climate. Although this range does not include a new record low, the lower bound is also quite close to the 2012 September extent.
Both statistical predictions therefore suggest that a new record or near-record low remains possible this year, were weather conditions conducive to severe sea ice loss to occur during late August.
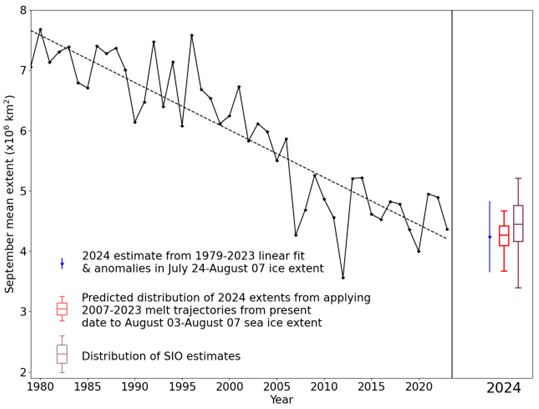
Figure 5. September Arctic sea ice extent since satellite records began in 1979 from the NSIDC Sea Ice Index (Fetterer et al., 2017), with SIPN Sea Ice Outlook and statistical predictions for September 2024. For the statistical prediction derived from linear fit, error bars represent twice the standard deviation of September mean ice extent about the trend lines with respect to which the estimates are taken. The range of predictions derived from past melting trajectories is shown as a red boxplot indicating range, median and quartiles of estimates derived from each trajectory in the 2007-2023 period. The Sea Ice Outlook is shown as a purple boxplot indicating range, median and quartiles of the 22 predictions submitted.
Antarctic
Antarctic sea ice state
Antarctic sea ice extent on 7th August 2024 was 15.86 million sq km (Figure 6). This was the 2nd lowest extent on record for this date, the lowest having been 14.99 million sq km in 2023. It was 1.51 million sq km below the 1981-2010 average.
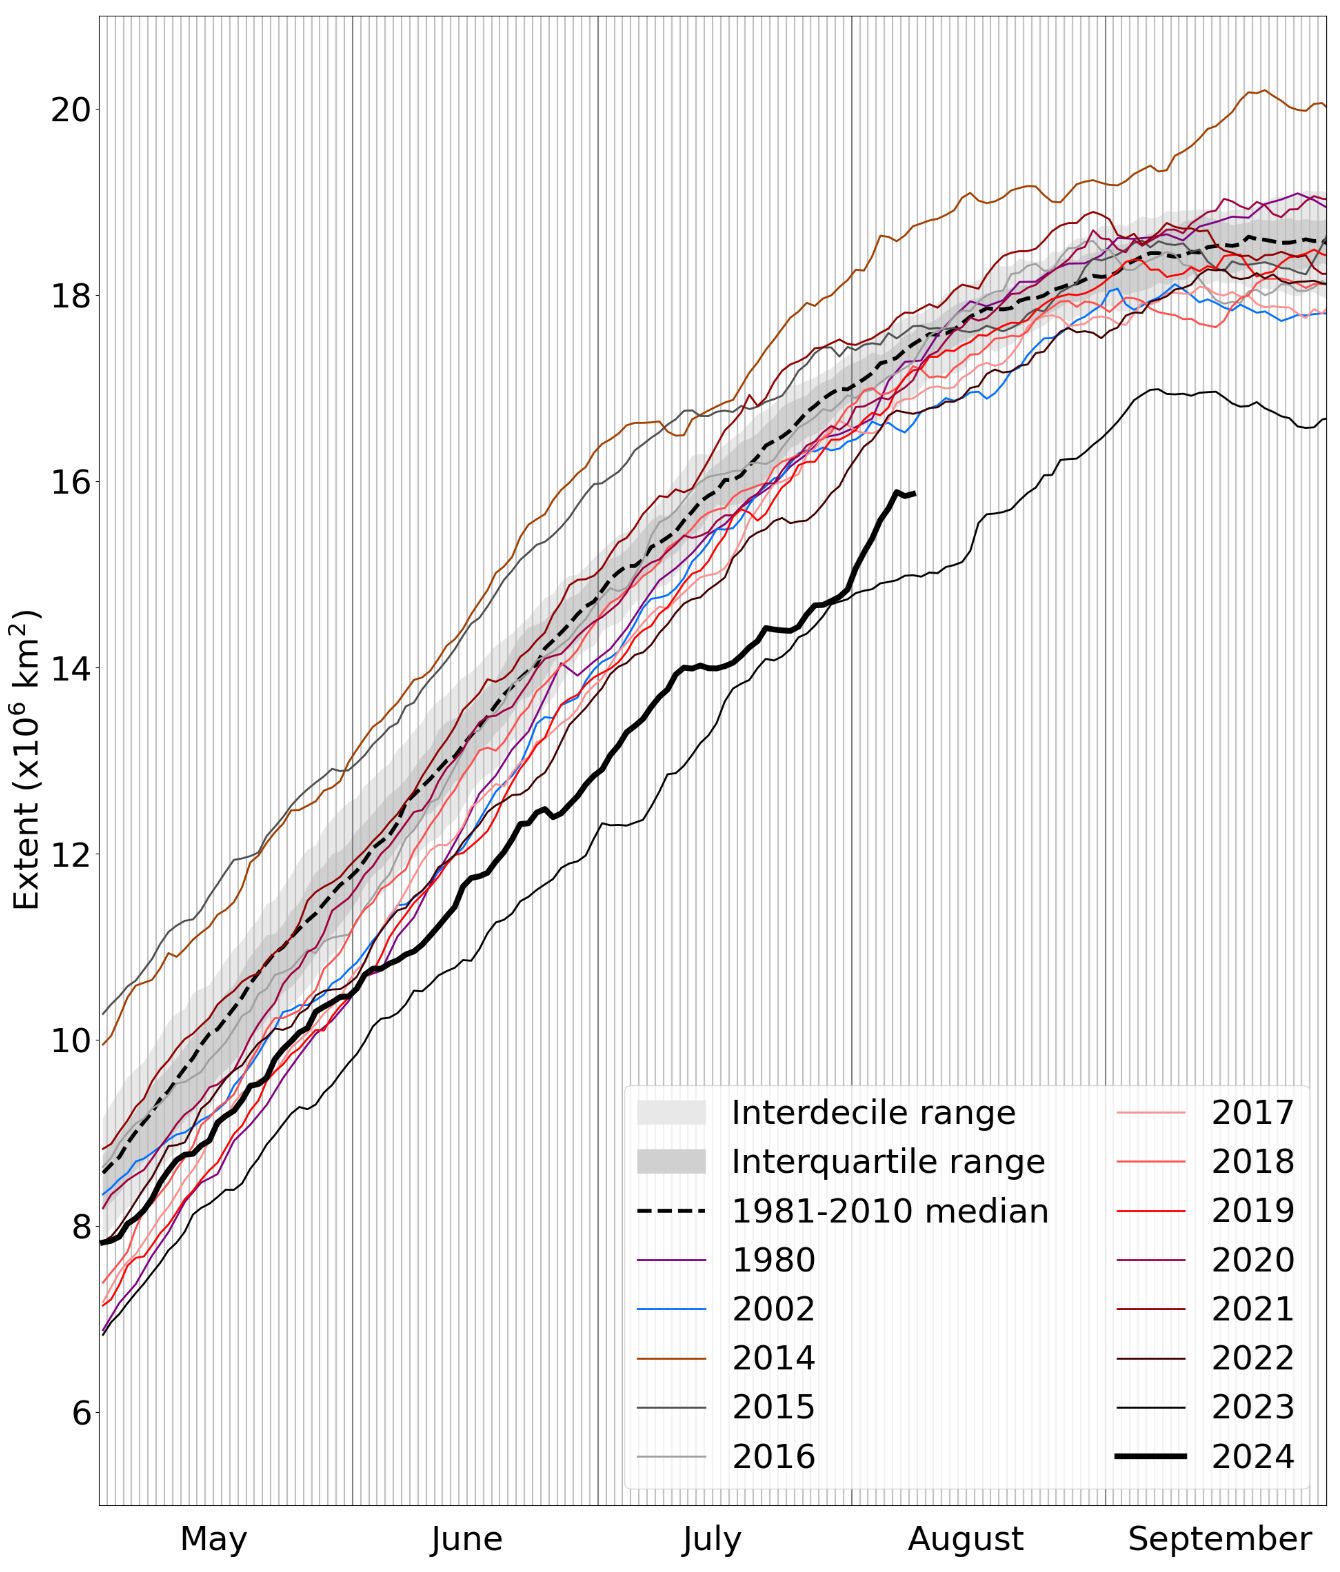
Figure 6. Daily Antarctic sea ice extent for 2024, compared with recent years, selected historic years with low ice cover, and the 1981-2010 average, with interquartile and interdecile ranges indicated by the shaded areas. Data are from NSIDC.
Extent was below average in most parts of the Southern Ocean, and exceptionally below average in the region between the Weddell Sea and the Indian Ocean Sector. However, extent was near average in the Ross Sea and somewhat above average in the regions bordering the Antarctic Peninsula.
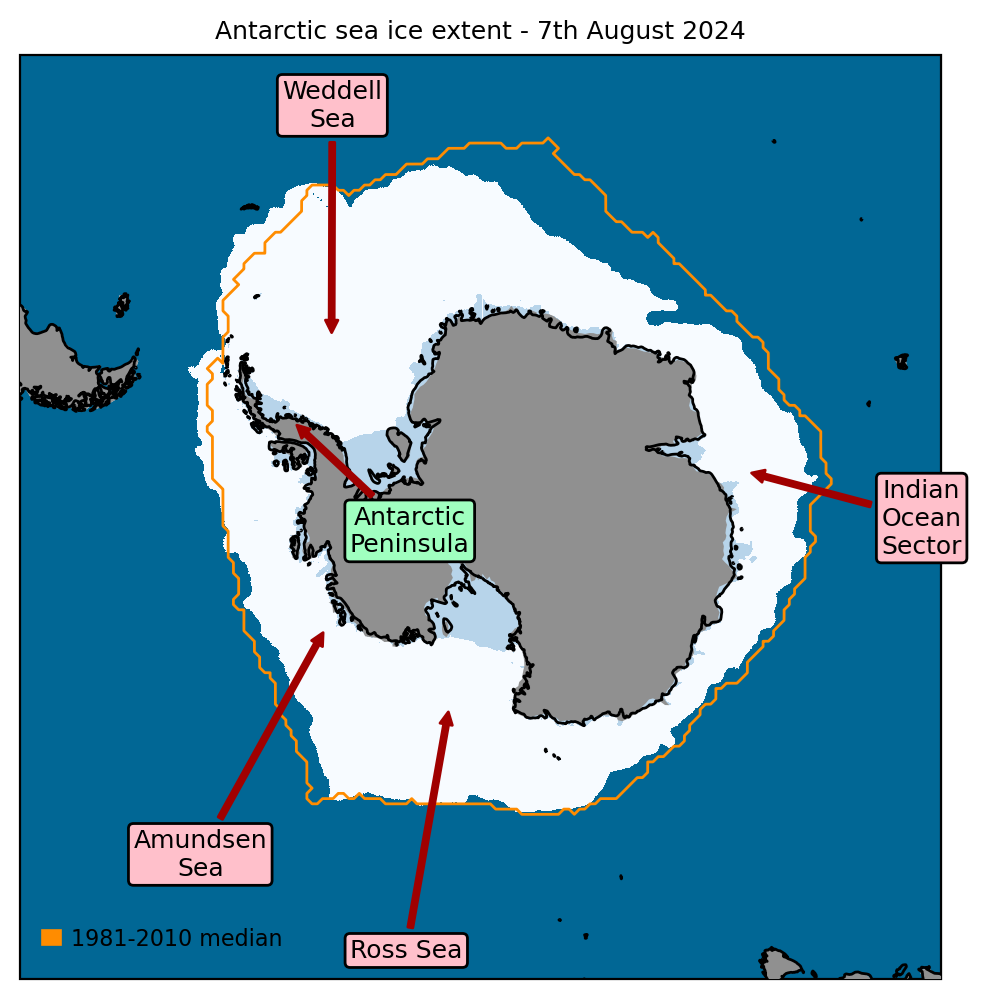
Figure 7. Antarctic sea ice extent on 7th August 2024, with 1981-2010 average extent indicated in orange, and the regions referred to in the text labelled. Data are from EUMETSAT OSI SAF (Tonboe et al., 2017).
Antarctic: July 2024 in context
2024 marks the second year in a row when ice growth during the Antarctic winter (June-August) has been exceptionally below average. Average July Antarctic extent this year and last was 13.49 and 14.11 million sq km respectively, whereas before last year the lowest July extent was 14.99 million sq km. At the end of July, sea ice extent briefly matched last year’s record low values for the time of year, but fast ice growth in the first week of August has increased ice extent to be considerably higher than last year, albeit still lower than any other year in the satellite record.
During both years, the position of the most severe sea ice deficits changed as the season progressed. This year, ice extent was lowest in May-June in the Amundsen Sea, but has since recovered somewhat, with very low anomalies developing instead in the region between the Weddell Sea and Indian Ocean sector (sometimes known as the King Haakon VII Sea). Last year, the lowest anomalies in June were observed in the Weddell Sea, but by August these had moved to the Ross Sea.
In all cases, the region with lowest sea ice had seen pronounced warm northerly winds for weeks or months, which suppress growth and compress the sea ice southwards. For example, July 2024 saw a two-wave pattern around Antarctica, with high pressure over the Ross Sea and Indian Ocean sector and low pressure between (Figure 8a). In the Southern Hemisphere, high pressure systems lie to the left following the wind direction, so warm northerly winds, with above-average temperatures occurred in the King Haakon VII Sea and to a lesser extent west of the Ross Sea (Figure 8b). Cold southerly winds in the Amundsen Sea region likely helped the recovery of sea ice here. At the beginning of August, the wind direction in the King Haakon VII Sea reversed, promoting the fast ice growth observed.
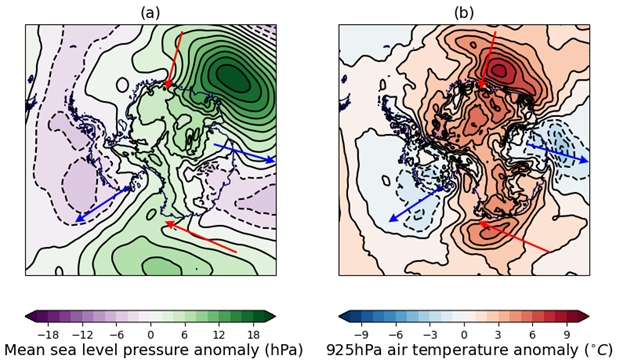
Figure 8. Near-surface Antarctic weather conditions for July 2024 relative to the 1981-2010 long-term average: (a) mean sea level pressure anomaly (hPa); (b) 925 hPa air temperature anomaly (°C). Data are from the ERA5 reanalysis (Hersbach et al., 2017). The main areas of warm and cold air movement are indicated with red and blue arrows respectively.
References
Fetterer, F., K. Knowles, W.N. Meier, M. Savoie and A.K. Windnagel (2017) Sea Ice Index, Version 3. Boulder, Colorado USA. National Snow and Ice Data Center. https://doi.org/10.7265/N5K072F8. Date Accessed: 08-08-2023.
Hersbach, H. et al. (2017) Complete ERA5 from 1940: Fifth generation of ECMWF atmospheric reanalyses of the global climate. Copernicus Climate Change Service (C3S) Data Store (CDS). https://doi.org/10.24381/cds.143582cf. Date Accessed: 08-08-2024.
Tonboe, R., J. Lavelle, R.-H. Pfeiffer and E. Howe (2017) OSI SAF Global Sea Ice Concentration. Product OSI-401-b. Version 1.6. September 2017, Available at: https://osi-saf.eumetsat.int/products/osi-401-b