

Briefing on the Arctic sea ice minimum and Antarctic sea ice maximum – September 2024
Alex West
Summary
- The Arctic sea ice minimum likely occurred on 11th September at a value of 4.28 million sq km. This would be the seventh lowest summer minimum recorded in the satellite era.
- Antarctic sea ice likely reached its winter maximum, of 17.15 million sq km, on 21st September. Whether or not this is subsequently exceeded, the 2024 maximum is likely to be the second lowest on record.
Arctic sea ice minimum
On 11th September, Arctic sea ice reached its likely minimum for the year, at 4.28 million sq km (Figure 1). This is the seventh-lowest minimum observed in the satellite record (since 1979). It is 1.95 million sq km below the 1981-2010 average, and 0.89 million sq km above the record low minimum of 2012. It is quite close to the long-term linear trend (Figure 2).
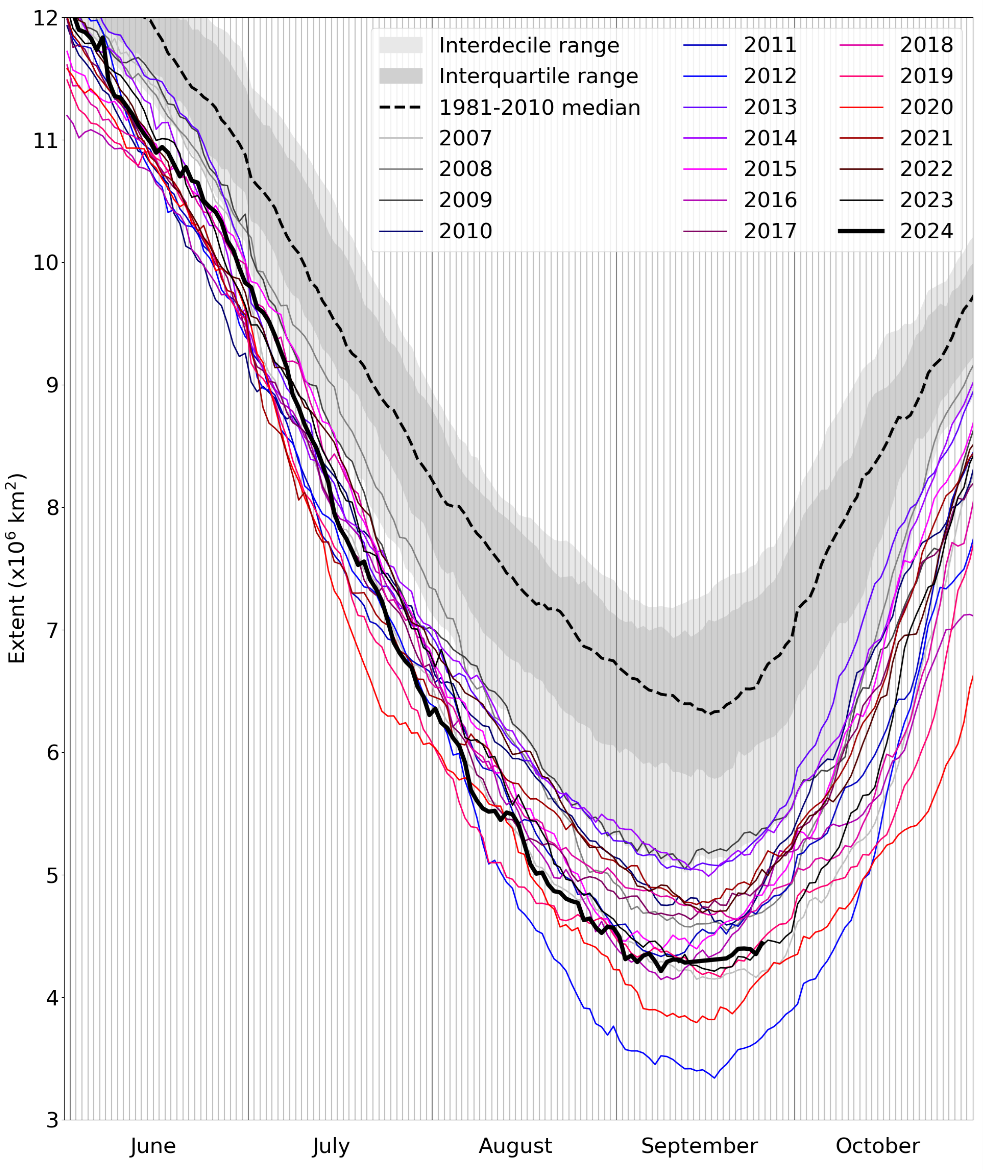
Figure 1. Daily Arctic sea ice extent for 2024, compared with recent years and the 1981-2010 average, with interquartile and interdecile ranges indicated by the shaded areas. Data are from the National Snow and Ice Data Center (NSIDC).
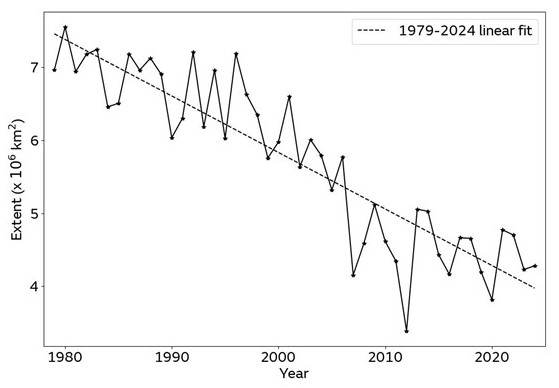
Figure 2. Arctic sea ice minima from 1979 to 2024 according to the NSIDC Sea Ice Index (Fetterer et al., 2017). The minimum sea ice extent is taken to be the lowest 5-day average.
Extent at minimum was well below average in all seas of the Arctic, more so in the Beaufort and Chukchi seas north of Alaska than in the Siberian coastal seas (Figure 3). In the Chukchi Sea, a small, isolated area of ice survived near the coast.
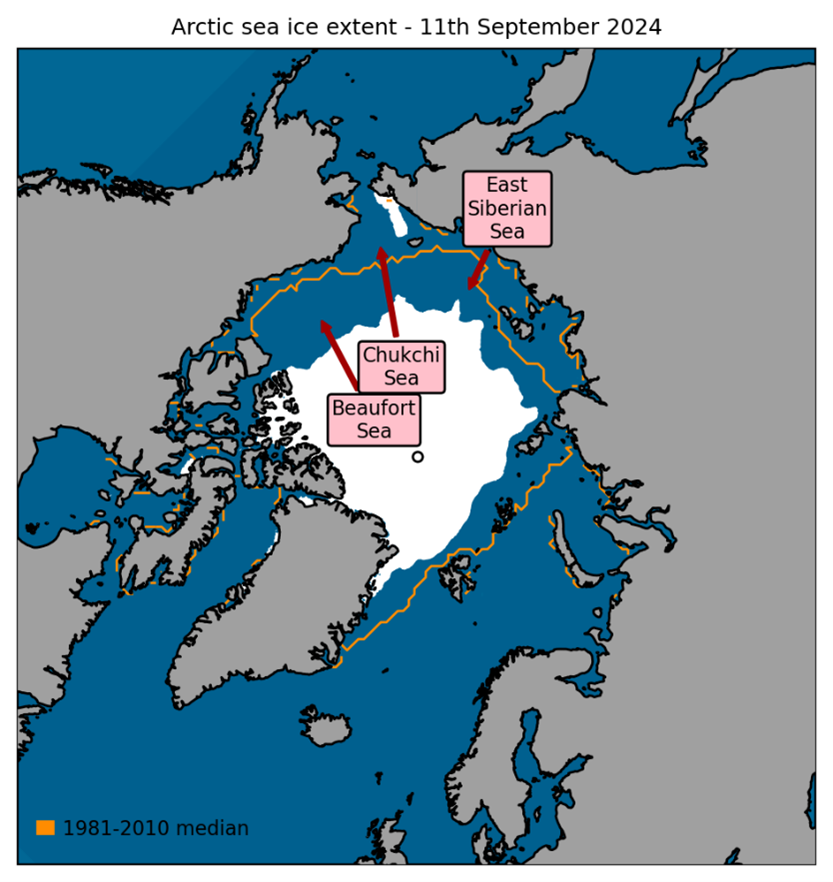
Figure 3. Annual minimum Arctic sea ice extent (11th September 2024), with 1981-2010 average extent for this date indicated in orange. Data are from EUMETSAT OSI-SAF (Tonboe et al., 2017).
Antarctic sea ice maximum
The maximum Antarctic sea ice extent to date is 17.15 million sq km, recorded on 21st September; however, ice extent has fallen only a little since then and it is possible that a higher value will be recorded before seasonal melt commences (Figure 4). Prior to this year, the lowest maximum Antarctic sea ice extent on record was recorded in 2023, at 16.96 million sq km, this being a very long way below the next lowest maximum of 17.88 million sq km, from 1986. It is very likely that this year will see the second lowest maximum on record even if the ice does increase further, as no year has ever recorded a maximum more than 0.53 million sq km above the value on 21st September.
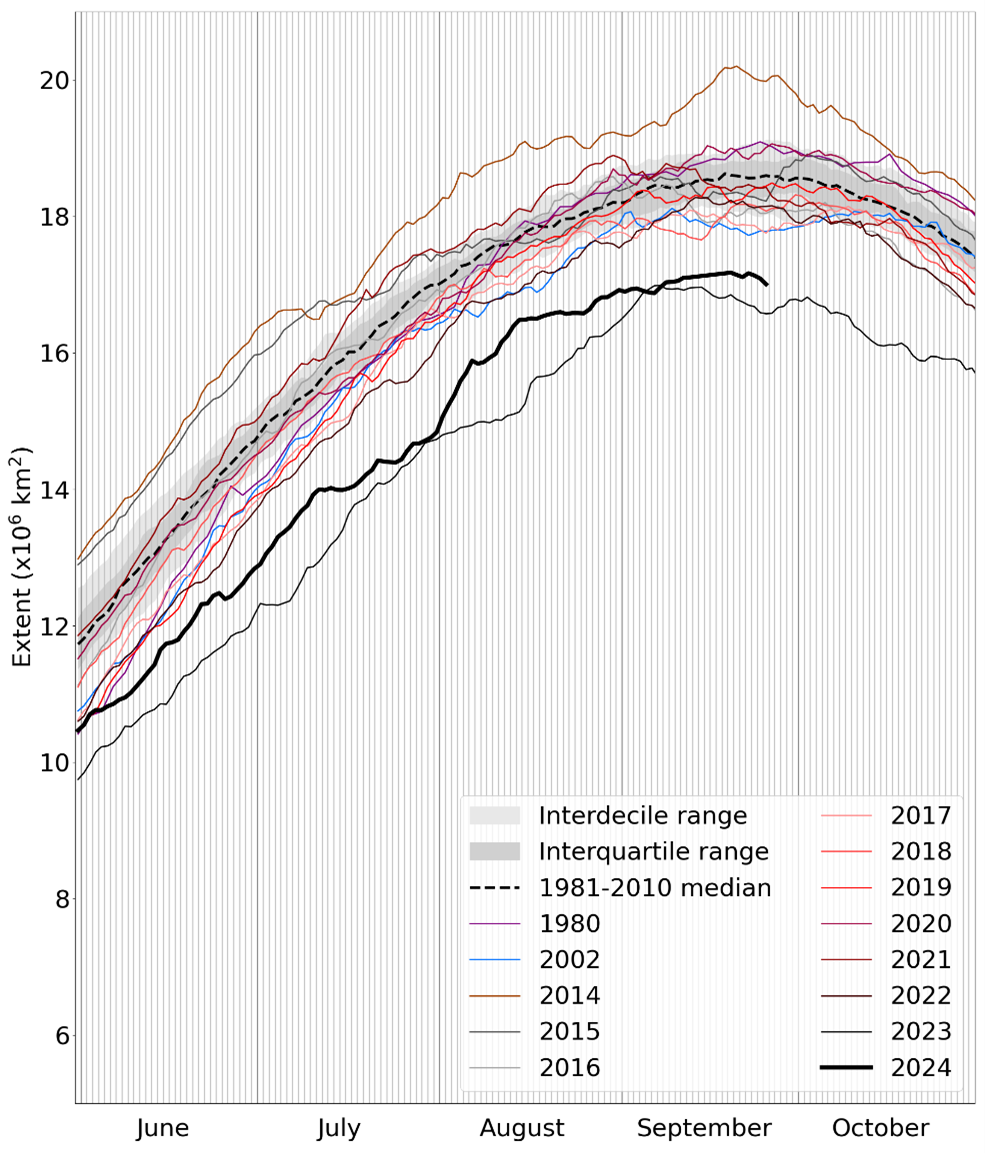
Figure 4. Daily Antarctic sea ice extent for 2024, compared with recent years, some historic low-ice years, and the 1981-2010 average, with +/- 1 and 2 standard deviation intervals indicated by the shaded areas. Data are from the National Snow and Ice Data Center (NSIDC).
On 21st September, Antarctic sea ice extent was well below average in the Ross and Weddell Seas, and exceptionally below average in the area between the Weddell Sea and Indian Ocean sector, sometimes known as the King Haakon VII Sea. However, it was somewhat above average in the Bellingshausen Sea, and in the region due south of Australia (Figure 5).
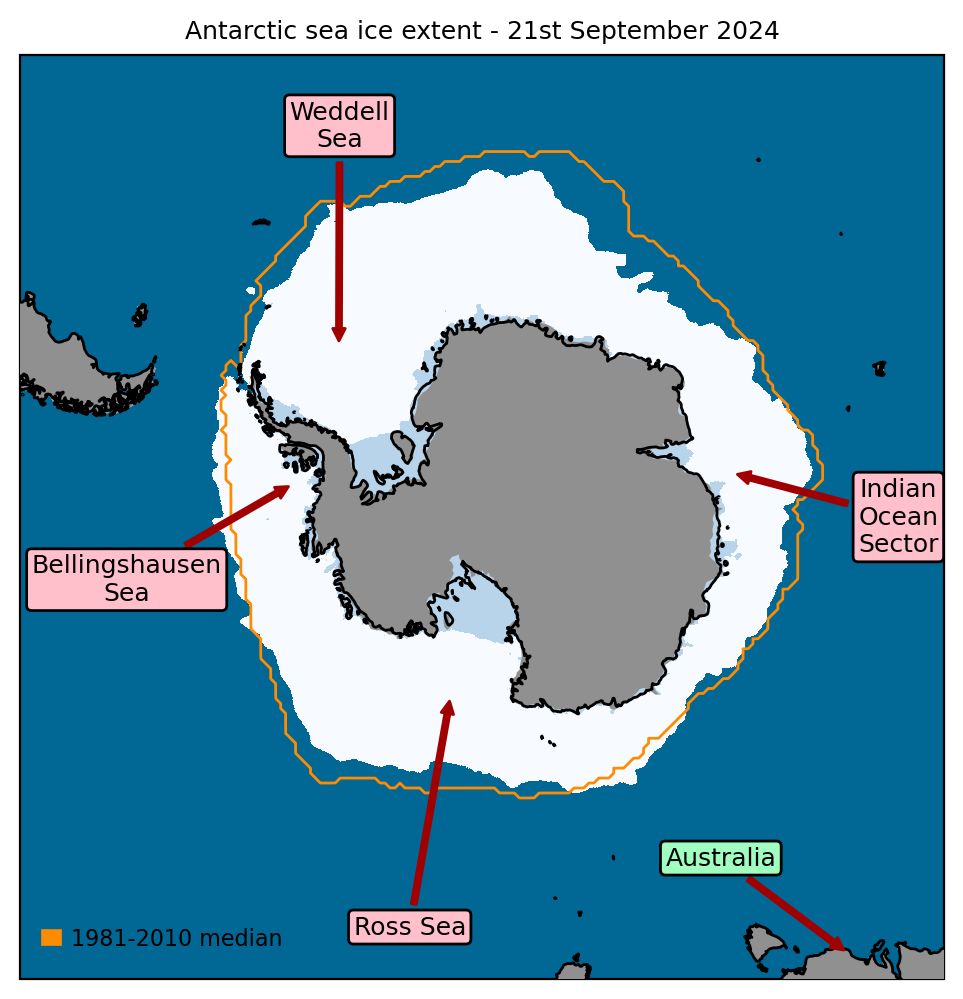
Figure 5. Maximum Antarctic sea ice extent at time of writing (recorded 21st September 2024), with 1981-2010 average extent for this date indicated in orange. Data are from EUMETSAT OSI-SAF (Tonboe et al., 2017).
References
Fetterer, F., K. Knowles, W.N. Meier, M. Savoie and A.K. Windnagel (2017) Sea Ice Index, Version 3. Boulder, Colorado USA. National Snow and Ice Data Center. https://doi.org/10.7265/N5K072F8. Date Accessed: 25-09-2024.
Tonboe, R., J. Lavelle, R.-H. Pfeiffer and E. Howe (2017) OSI SAF Global Sea Ice Concentration. Product OSI-401-b. Version 1.6. September 2017, Available at: https://osi-saf.eumetsat.int/products/osi-401-b. Date Accessed: 25-09-2024.