Arctic and Antarctic end-of-season report - October 2024
Alex West and Ed Blockley
Summary
- Arctic sea ice extent for September 2024 was joint-4th lowest on record.
- Areas of moderately low ice extent were evenly spread over most of the Arctic, though a small area of isolated ice survived in the Chukchi Sea
- Summer Arctic weather was warm early in the season but cool later on, relative to average conditions
- Arctic September extent was close to the median of predictions submitted to the Sea Ice Outlook; however statistical or machine-learning predictions tended to be higher and dynamic model predictions lower.
- Antarctic sea ice extent for September 2024 was second lowest on record after 2023, but well below the next lowest, recorded in 1986.
- Following two consecutive years of very low winter sea ice growth, the long-term trend in Antarctic sea ice extent is now negative but the trend is not significant. However, the trend over the past 15 years (since 2009) is very strongly negative.
Arctic sea ice extent
Arctic sea ice extent for September 2024 was 4.36 million sq km. This was the joint-4th lowest September extent on record (since 1979), effectively equal to 2019 and 2023, but higher than 2012, 2020 and 2007. It was 2.05 million sq km below the 1981-2010 average, and quite close to the long-term linear trend (Figure 1).
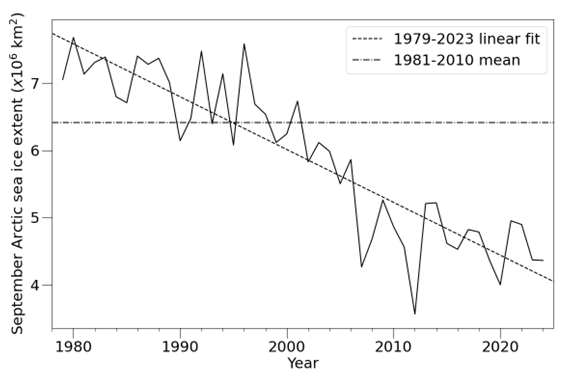
Figure 1. September Arctic sea ice extent during the satellite era, according to the NSIDC Sea Ice Index (Fetterer et al., 2017), with linear trend indicated.
Areas of below-average extent were spread fairly evenly throughout the Arctic Ocean in September 2024 (Figure 2). No region saw near- or above-average extent, except the Chukchi Sea where a small, isolated region of ice survived off the East Siberian coast.
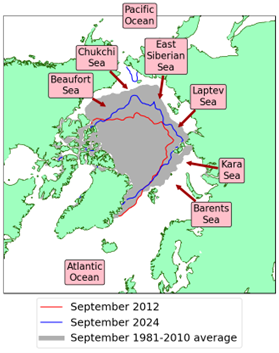
Figure 2. Arctic sea ice extent in September 2024, compared to the record low year of 2012 and the 1981-2010 average, with regions named in the text labelled. Data are from EUMETSAT OSI SAF (Tonboe et al., 2017).
While the Arctic summer was 1.88°C warmer than average according to the ERA5 dataset, it was considerably cooler than the record warm summer of 2020 (Figure 3). June was exceptionally warm, with a pronounced high-pressure ridge extending from East Siberia to the central Arctic, helping to blow warm air over much of the Arctic Ocean. As the season progressed, however, the high pressure weakened, allowing a larger influence from Arctic storms, and temperatures became progressively cooler. Overall, the summer was warmest over the Barents, Kara and Laptev seas north of Western Siberia, and coolest in the Chukchi Sea (Figure 4a). The average pressure pattern was weak over the Arctic Ocean, as the high pressure associated with settled weather early in the season was balanced out by stormy weather (low pressure) later in the season (Figure 4b).
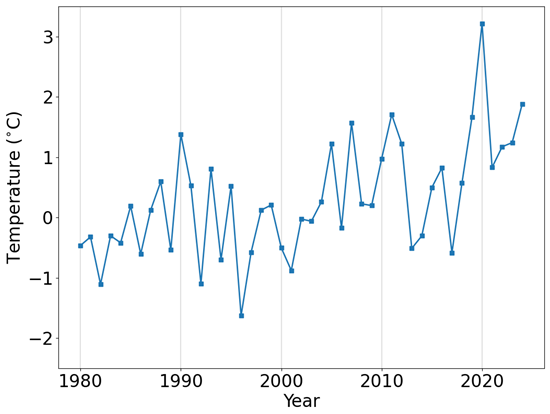
Figure 3. Average May-August temperature anomaly, relative to the 1981-2010 average, for the Arctic Ocean region. Temperatures are taken at the 925hPa level (about 1km above the surface) to show the effect of atmospheric circulation on the sea ice, as surface temperatures are strongly influenced by the sea ice itself. Data are from the ERA5 reanalysis (Hersbach et al., 2017).
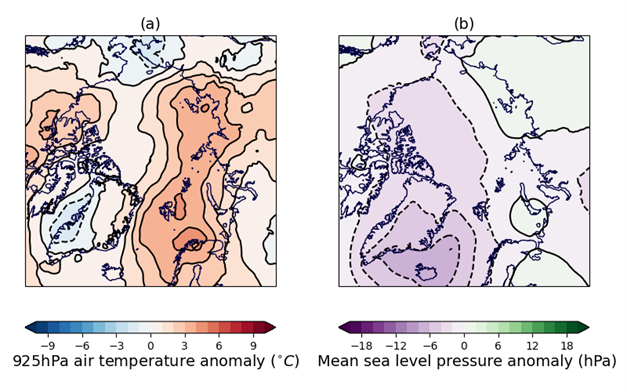
Figure 4. Anomaly in (a) 925hPa air temperature (°C); (b) mean sea level pressure (hPa), relative to the 1981-2010 average, for May-August 2024. Data are from the ERA5 reanalysis (Hersbach et al., 2017).
The warm weather of June may have preconditioned the sea ice for rapid melt, because melt ponds are darker than sea ice, and absorb more sunlight. Well above-average sea ice melt was a feature of much of July despite moderating temperatures, and a weather pattern with winds blowing from the Atlantic to the Pacific, not usually associated with rapid sea ice loss. August was notably cool across much of the Arctic Ocean (except in regions where ice had already melted out, such as the Kara Sea) and during this month sea ice loss rapidly slowed to average.
Assessment of Arctic predictions
September Arctic sea ice extent fell towards the median of predictions submitted to the Sea Ice Outlook (SIO) in June, July and August (Figure 5), consistent with previous reports that predictions are more accurate in years when September sea ice is close to the long-term linear trend. However, this masks an unusual divergence between predictions from dynamical models, which tended to predict lower extent than observed, and those from statistical or machine-learning (ML) methods, which tended to predict higher extent than observed.
In July, predictions from the two methods fell into entirely separate ranges, with the eventual September extent roughly in the middle of these. It is possible that this reflected dynamic models responding to the warm weather of late May and June, without fully capturing the switch to cooler conditions that occurred subsequently. In August, the median of the statistical/ML predictions, and to a lesser extent that of the dynamic model predictions, were close to the observed September extent.
The Met Office statistical predictions of September sea ice extent, published in the July and August briefings, somewhat overestimated extent prior to the rapid ice melt of July, although at no stage was the eventual September sea ice extent outside the 95% uncertainty intervals. During August, the eventual September extent was slightly underestimated, due to the switch to near-average melting that occurred late in summer.
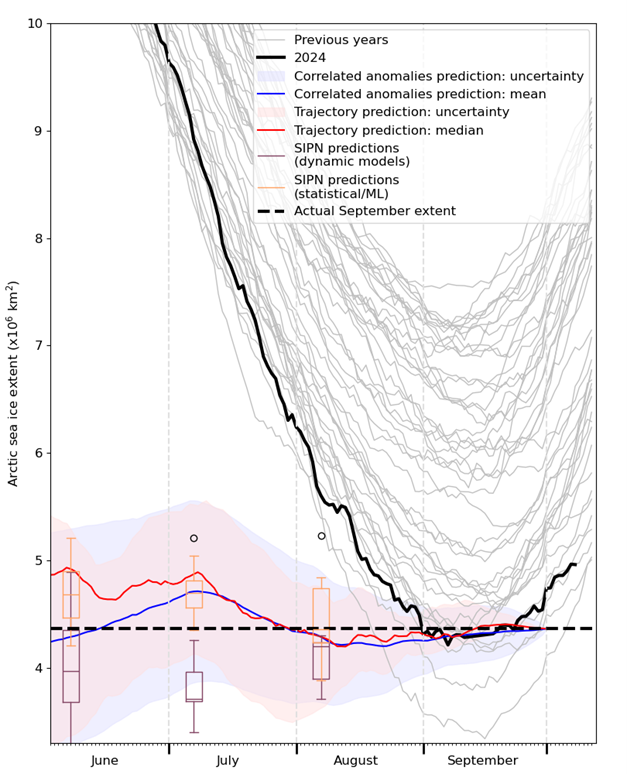
Figure 5. An evaluation of predictions of 2024 September sea ice extent submitted to the Sea Ice Prediction Network (SIPN), alongside statistical predictions performed for the July and August sea ice briefings. Evolution of sea ice extent during the summer in 2024 and previous years is shown for context.
Antarctic sea ice extent
Antarctic sea ice extent for September 2024 was 17.04 million sq km. This was the 2nd lowest September extent on record, after 16.80 million sq km in 2023, and well below the next lowest extent of 17.69 million sq km recorded in 1986. It was 1.41 million sq km below the 1981-2010 average (Figure 6).
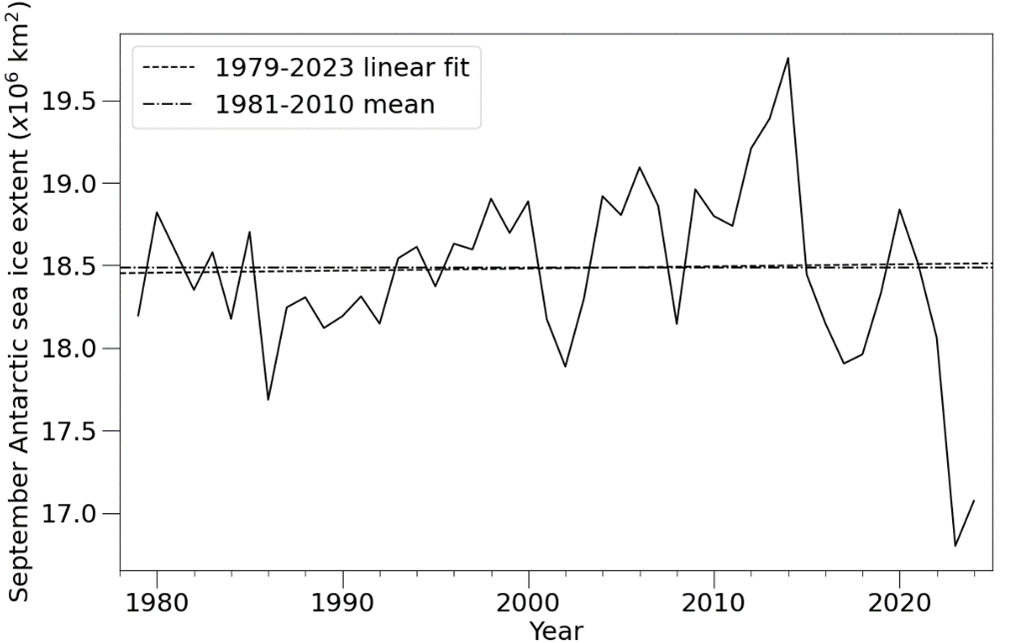
Figure 6. September Antarctic sea ice extent during the satellite era, according to the NSIDC Sea Ice Index (Fetterer et al., 2017), with linear trend indicated.
Average September extent anomalies varied regionally (Figure 7): extent was above average in the seas surrounding the Antarctic Peninsula (the western Weddell and Bellingshausen Seas) but was well below average from the Indian Ocean Sector to the eastern Weddell Sea). The regional pattern observed in September 2024 was similar to that observed last year in September 2023, except that extent was notably higher in the Ross Sea sector.
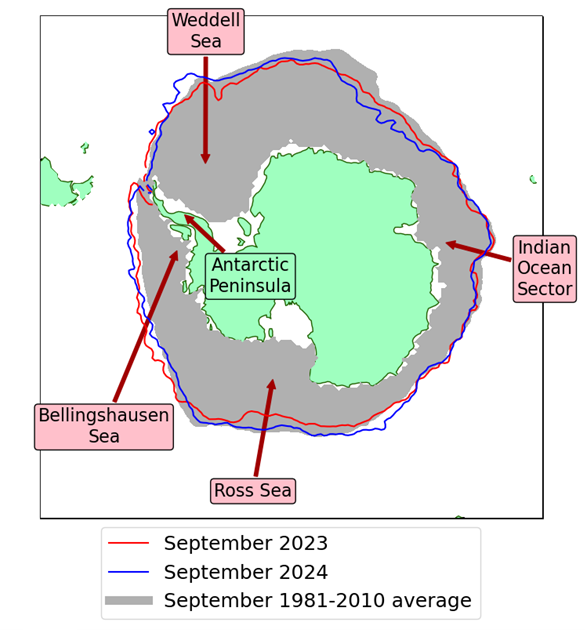
Figure 7. Antarctic sea ice extent in September 2024, compared to the record low year of 2023 and the 1981-2010 average, with regions named in the text labelled. Data are from EUMETSAT OSI SAF (Tonboe et al., 2017).
2024 marks the second year in a row in which Antarctic winter sea ice growth has been exceptionally below average. Although the past two years have been particularly low, they continue a prolonged period of below-average extent that began in 2016. It has been suggested that changes in ocean circulation, with stronger westerly winds pushing warmer water to the surface of the Southern Ocean, are partly responsible for this (e.g., Purich and Doddridge, 2023). Changes in atmospheric circulation, with more exchange of warm air with lower latitudes, may also be responsible (e.g., Schroeter et al., 2023), and have been implicated in the 2023 record low ice extent (Ionita, 2024).
The trend in Antarctic sea ice extent over the satellite era (since 1979) is now negative at -0.04 million sq km per decade. However, this is not a statistically significant trend, partly because of a period of very high extent from 2012-2014 immediately prior to the 2016 fall in extent. In fact, one of the most prominent features of the long-term Antarctic sea ice extent timeseries is a marked increase in variability from 2007 onwards, with very high anomalies followed by very low ones (Figure 8). The trend over the past 15 years is strongly negative at -1.21 million sq km per decade.
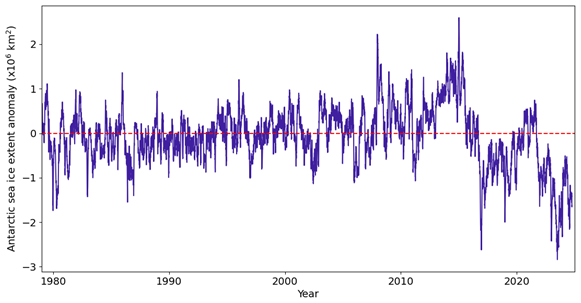
Figure 8. Antarctic sea ice extent anomaly, relative to the 1981-2010 average, over the era of satellite observations (since 1979).
References
Fetterer, F., K. Knowles, W.N. Meier, M. Savoie and A.K. Windnagel (2017) Sea Ice Index, Version 3. Boulder, Colorado USA. National Snow and Ice Data Center. https://doi.org/10.7265/N5K072F8. Date Accessed: 08-10-2024.
Hersbach, H. et al. (2017) Complete ERA5 from 1940: Fifth generation of ECMWF atmospheric reanalyses of the global climate. Copernicus Climate Change Service (C3S) Data Store (CDS). https://doi.org/10.24381/cds.143582cf. Date Accessed: 08-08-2024.
Ionita M (2024) Large-scale drivers of the exceptionally low winter Antarctic sea ice extent in 2023. Front. Earth Sci., 12, 1333706. https://doi.org/10.3389/feart.2024.1333706
Purich, A. and E.W. Doddridge (2023) Record low Antarctic sea ice coverage indicates a new sea ice state. Commun. Earth Environ., 4, 314. https://doi.org/10.1038/s43247-023-00961-9
Schroeter, S., T. J. O'Kane and P. A. Sandery (2023) Antarctic sea ice regime shift associated with decreasing zonal symmetry in the Southern Annular Mode. The Cryosphere, 17, 701-717. https://doi.org/10.5194/tc-17-701-2023
Tonboe, R., J. Lavelle, R.-H. Pfeiffer and E. Howe (2017) OSI SAF Global Sea Ice Concentration. Product OSI-401-b. Version 1.6. September 2017, Available at: https://osi-saf.eumetsat.int/products/osi-401-b


