UK Climate Resilience Programme infographics
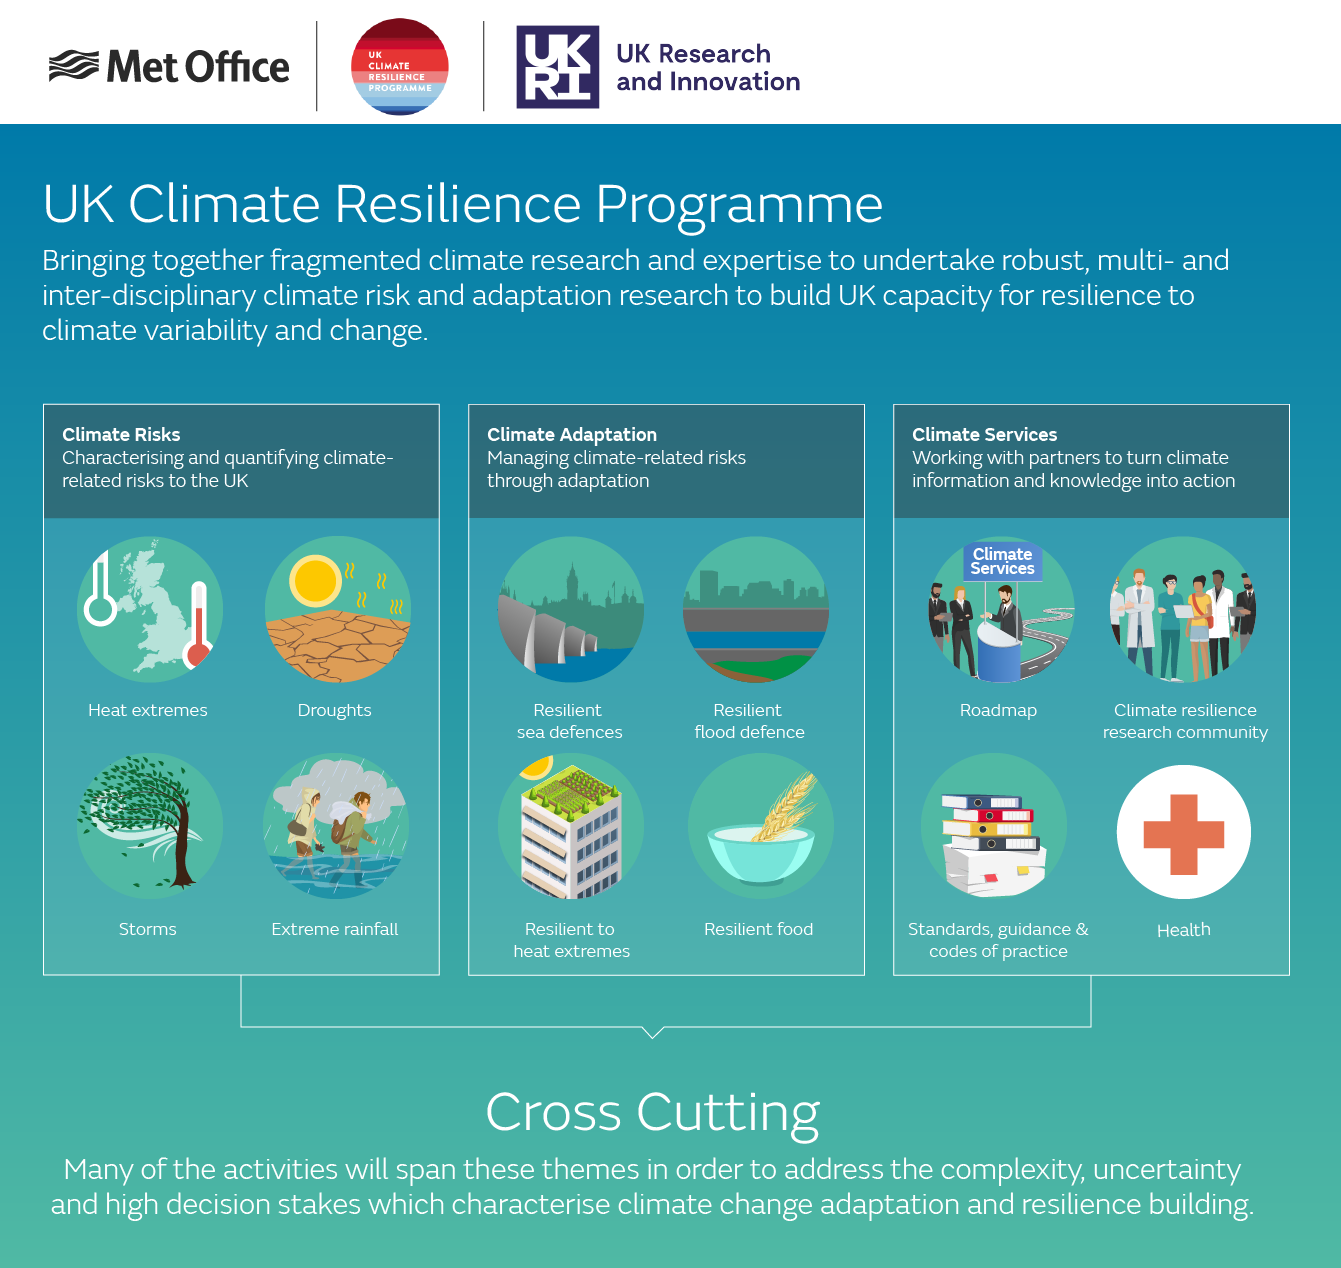
The UK Climate Resilience Programme ran from 2019 to 2023. As part of our role in co-leading the programme, we produced various infographics to help communicate its outputs.
Programme overview and legacy
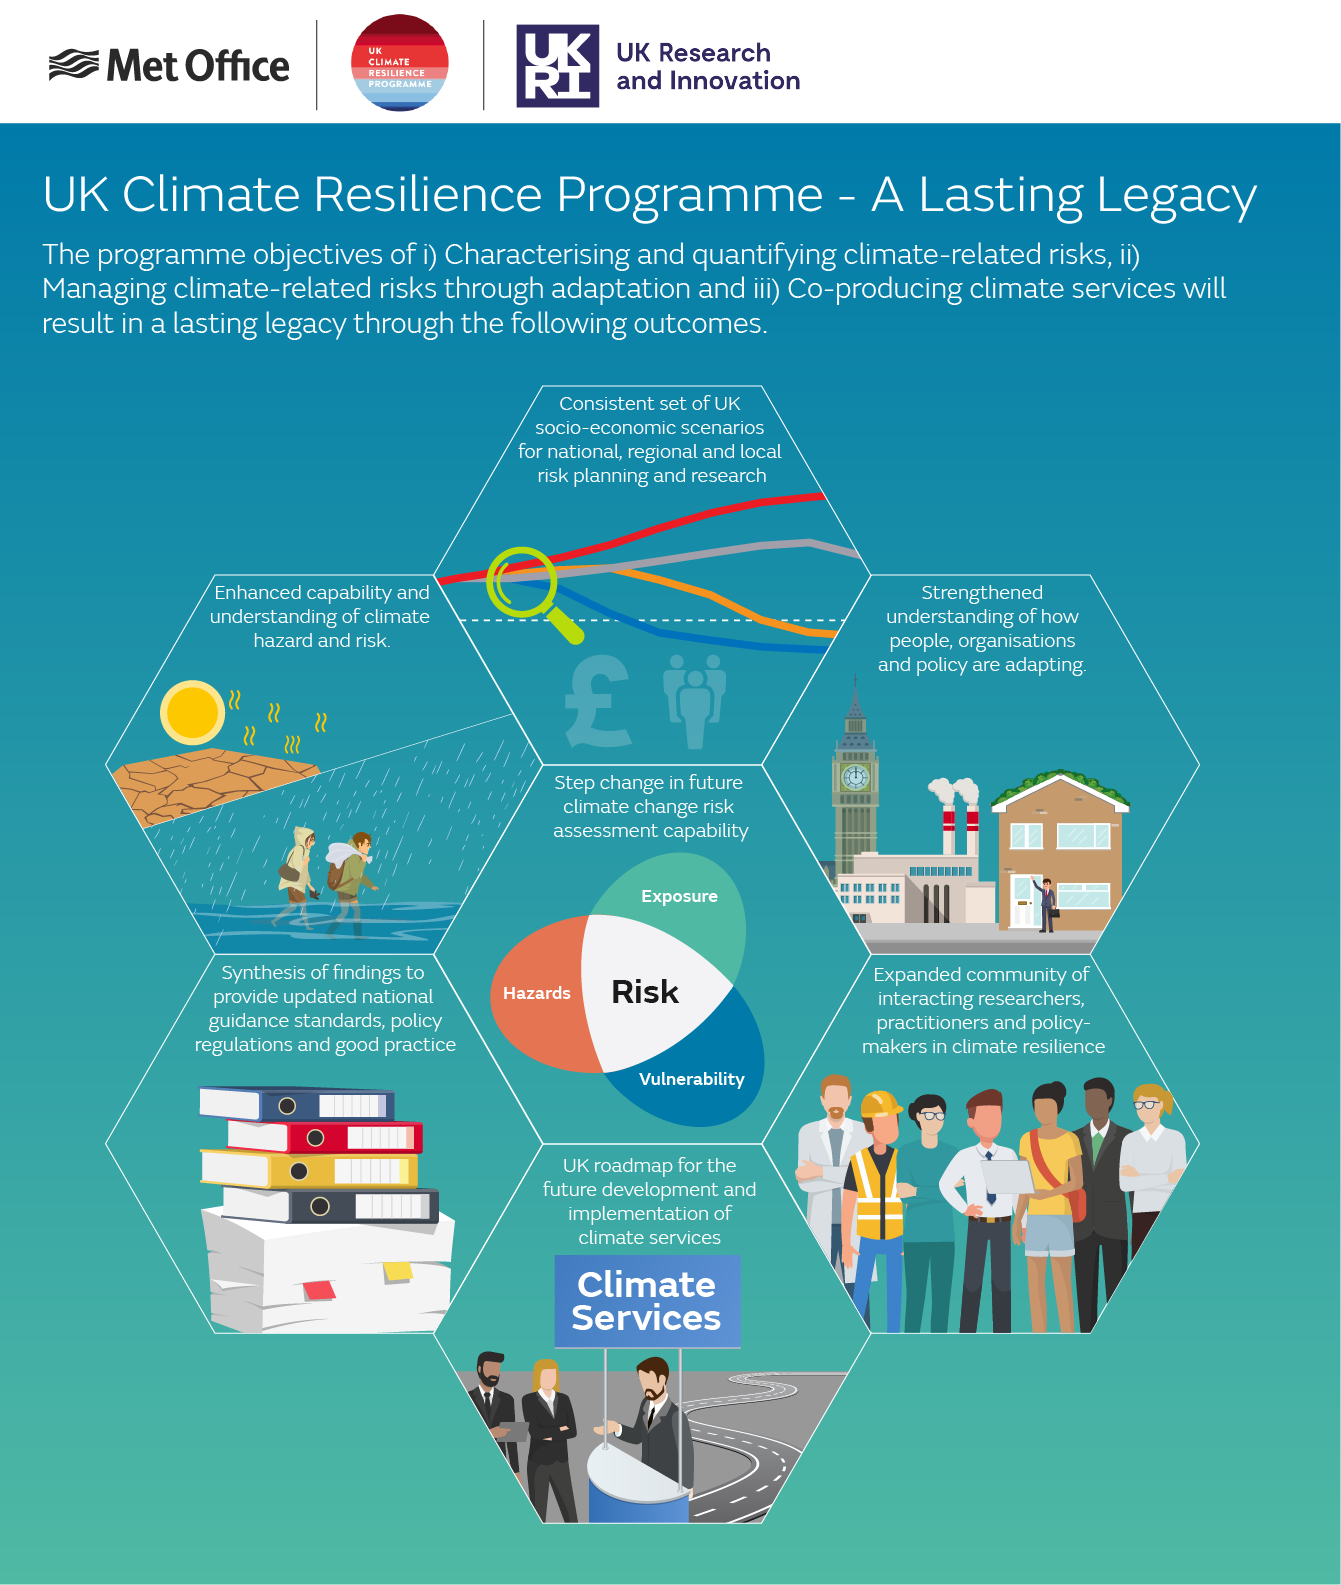
The infographics below show the programme's strategic themes and how it will achieve a lasting legacy.
From climate hazard to climate risk
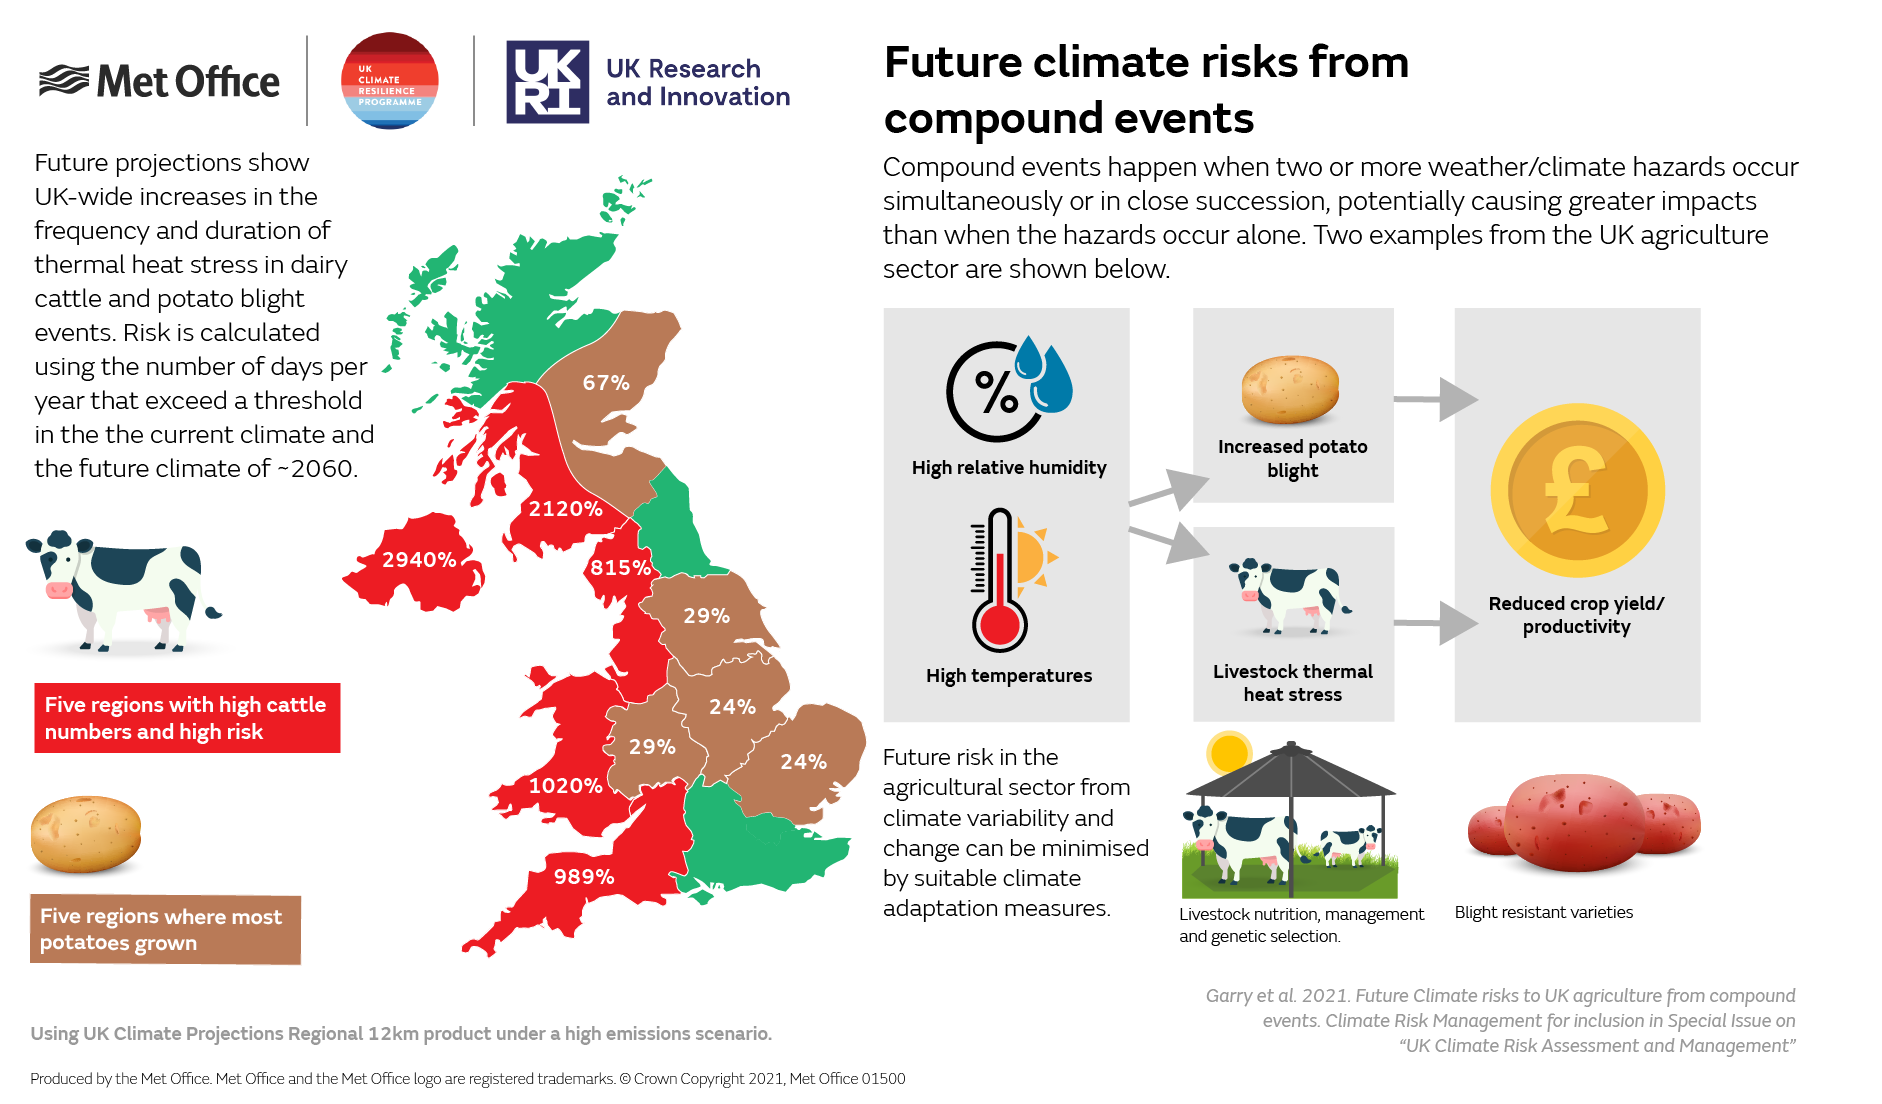
As part of the Multiple Hazards projects within the work package From climate hazard to climate risk, we found that climate change will increase agricultural hazards. In particular it is likely to have a serious impact on two of the UK’s agricultural staples, dairy farming and potato growing. This is illustrated in the infographic below.
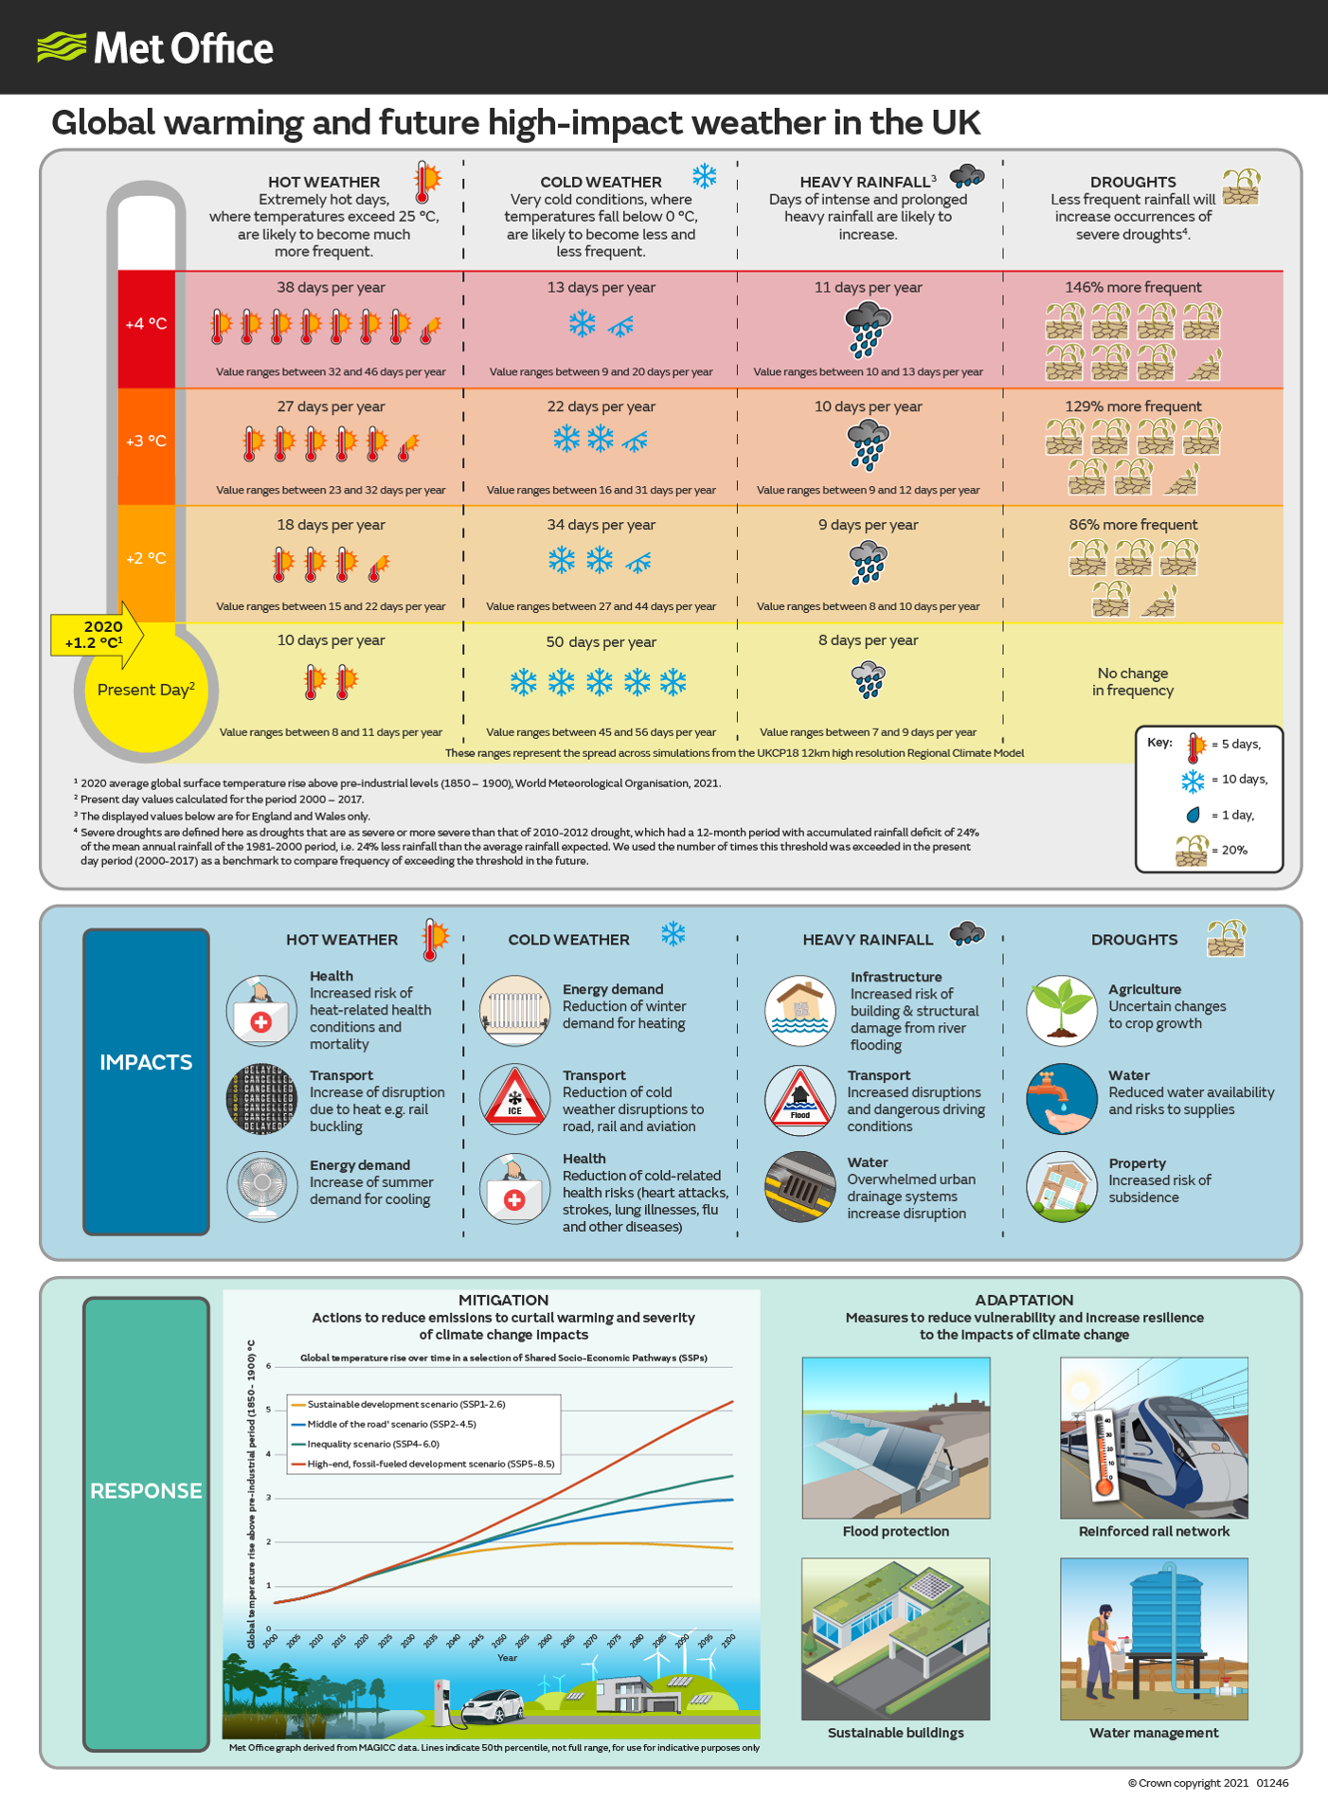
The research also involved translating raw climate projections into more impact relevant metrics, such as the change in frost days or extreme rainfall over the UK. It provided metrics for different levels of future global warming from 1.5°C above pre-industrial times up to 4°C of global warming. We also produced an infographic about global warming and future high-impact weather in the UK:
 Communication of uncertainty
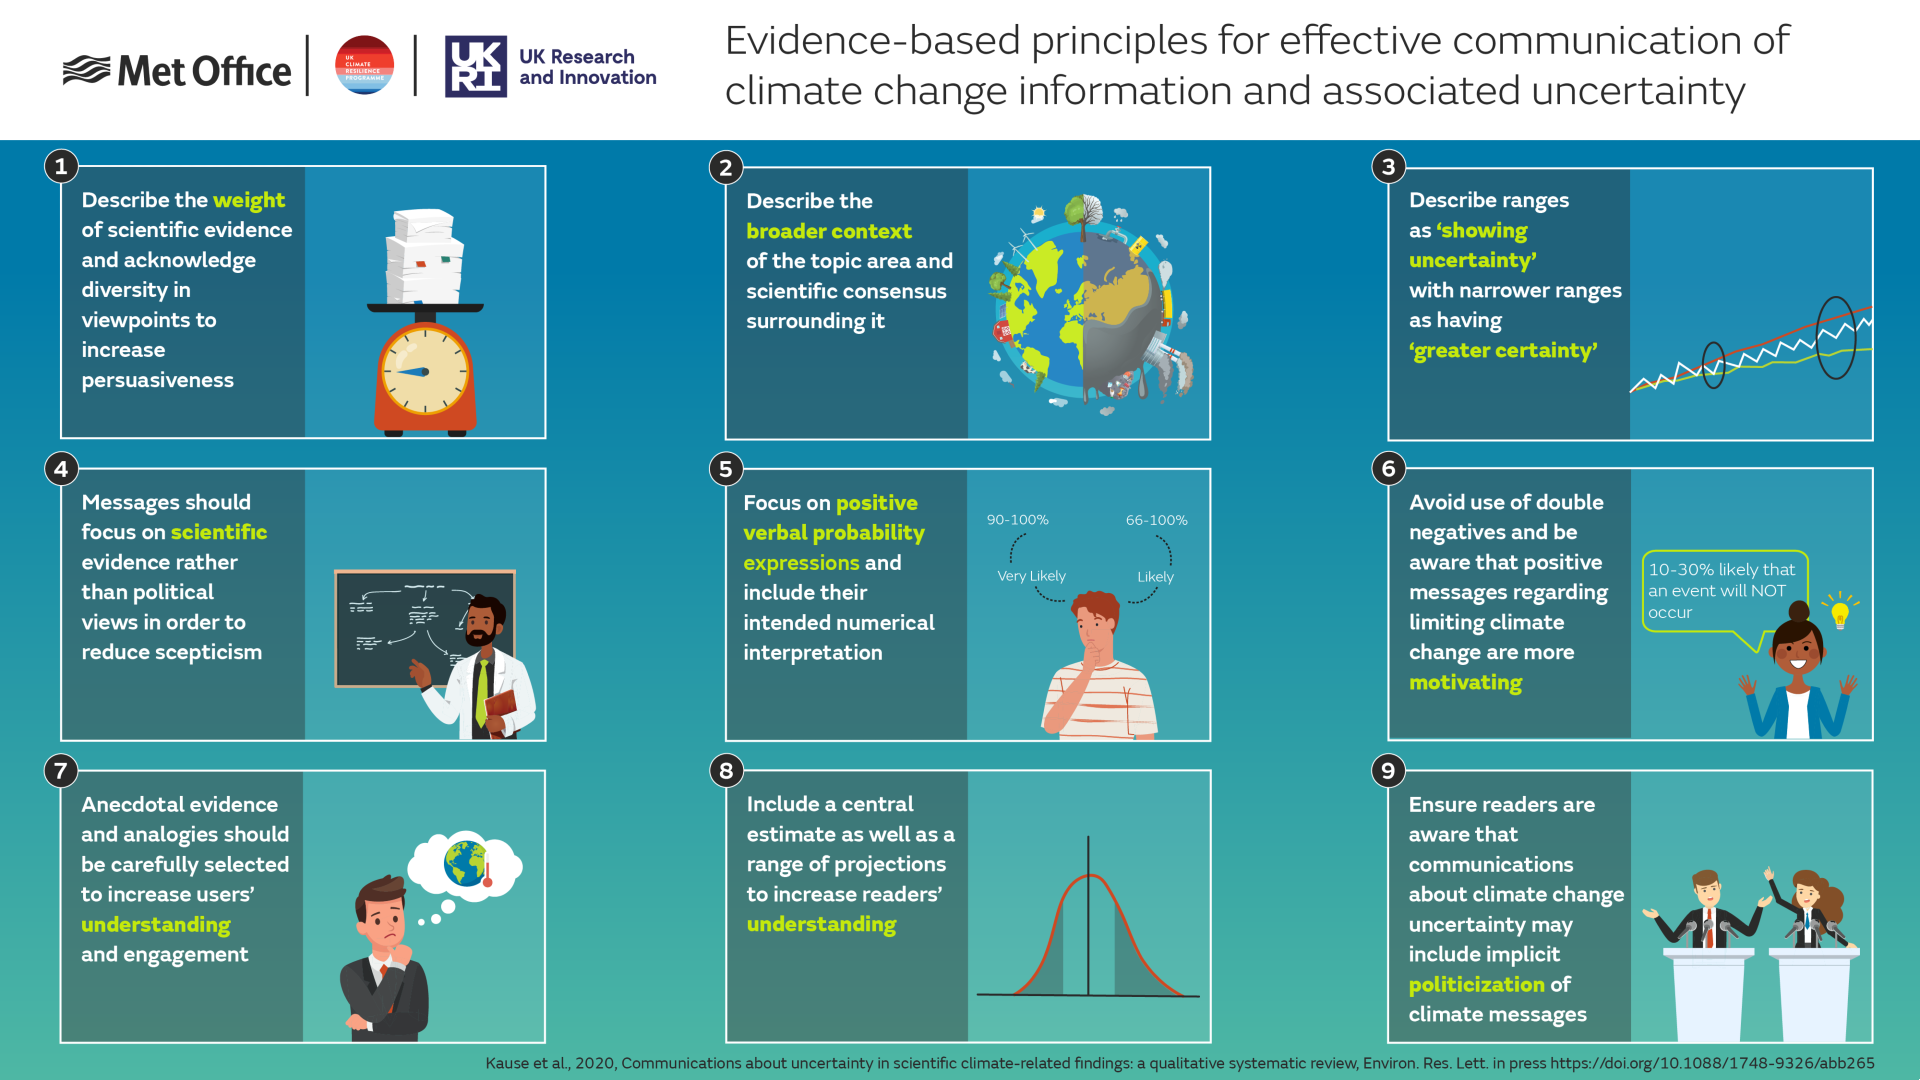
This project, led by the University of Leeds, reviewed empirical studies from the cognitive and psychological sciences exploring non-experts’ responses to uncertain climate information. We produced two infographics to illustrate the findings from this project.

UK socioeconomic scenarios for climate research and policy
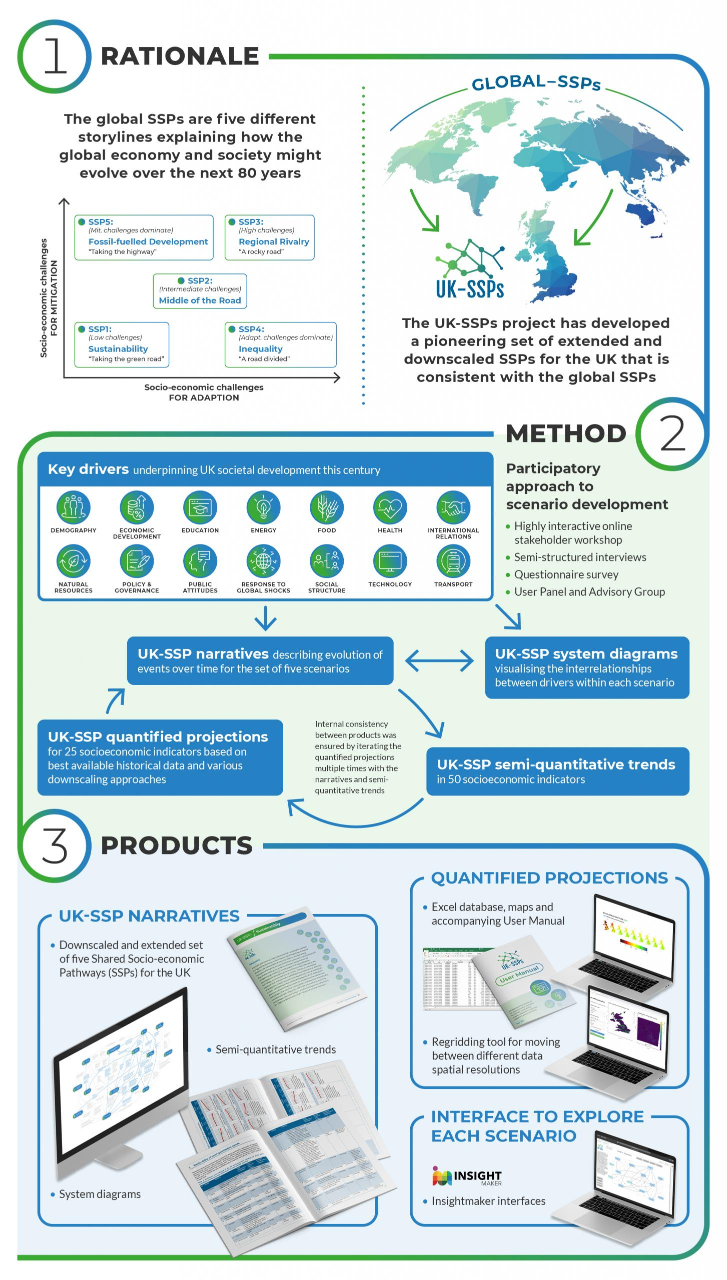
This project developed shared socioeconomic pathways (SSPs) for the UK, to help answer key questions about the country’s resilience to climate change. The infographic below, developed by Cambridge Econometrics, provides a visual overview of the project.
Improved climate hazard information
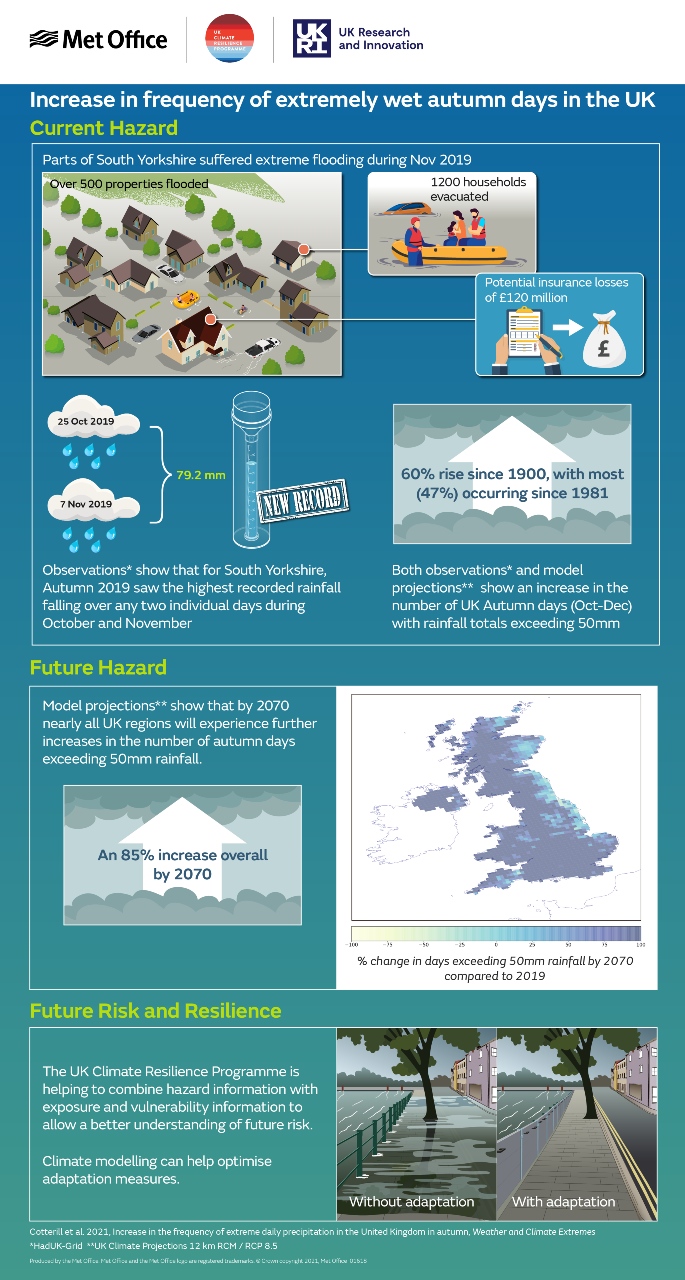
As part of the Improving Climate Hazard Information work package, led by the Met Office, we produced an infographic about the increase in frequency of extremely wet autumn days in the UK.
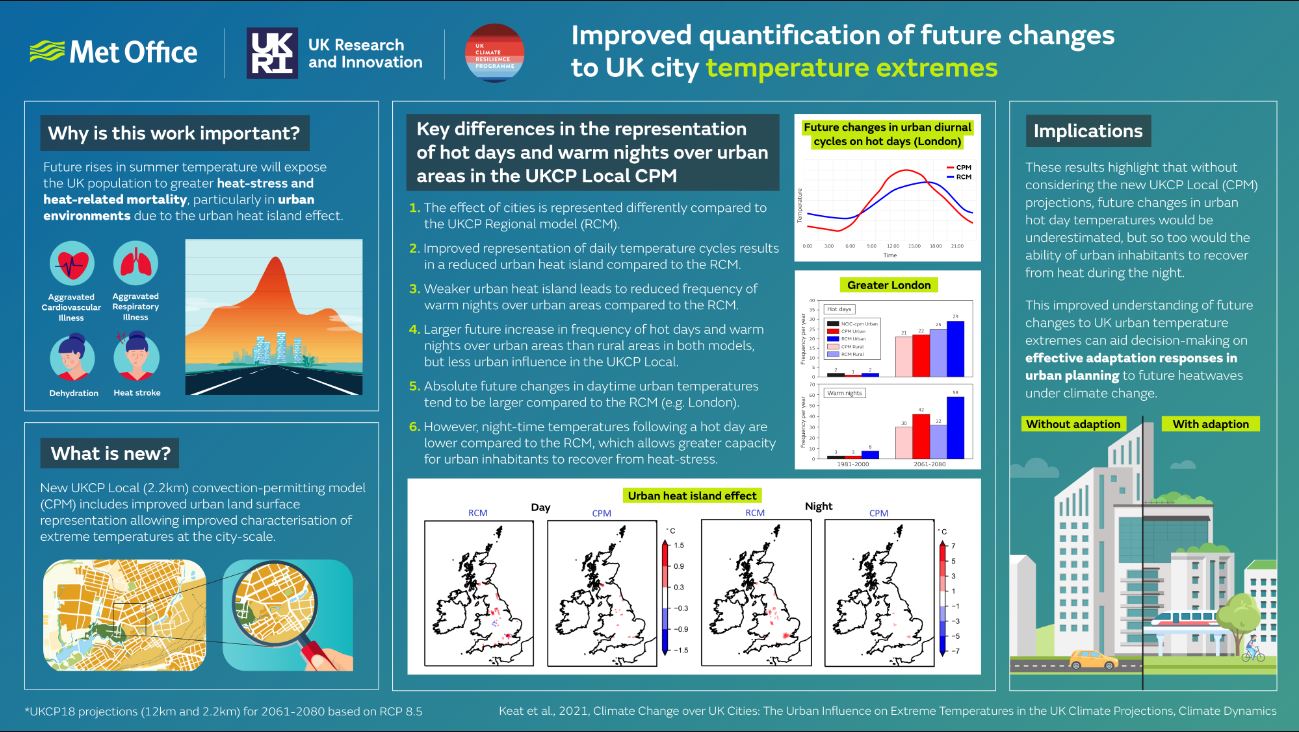
We also produced an infographic about improved quantification of future changes to UK City temperature extremes.
End of programmes successes
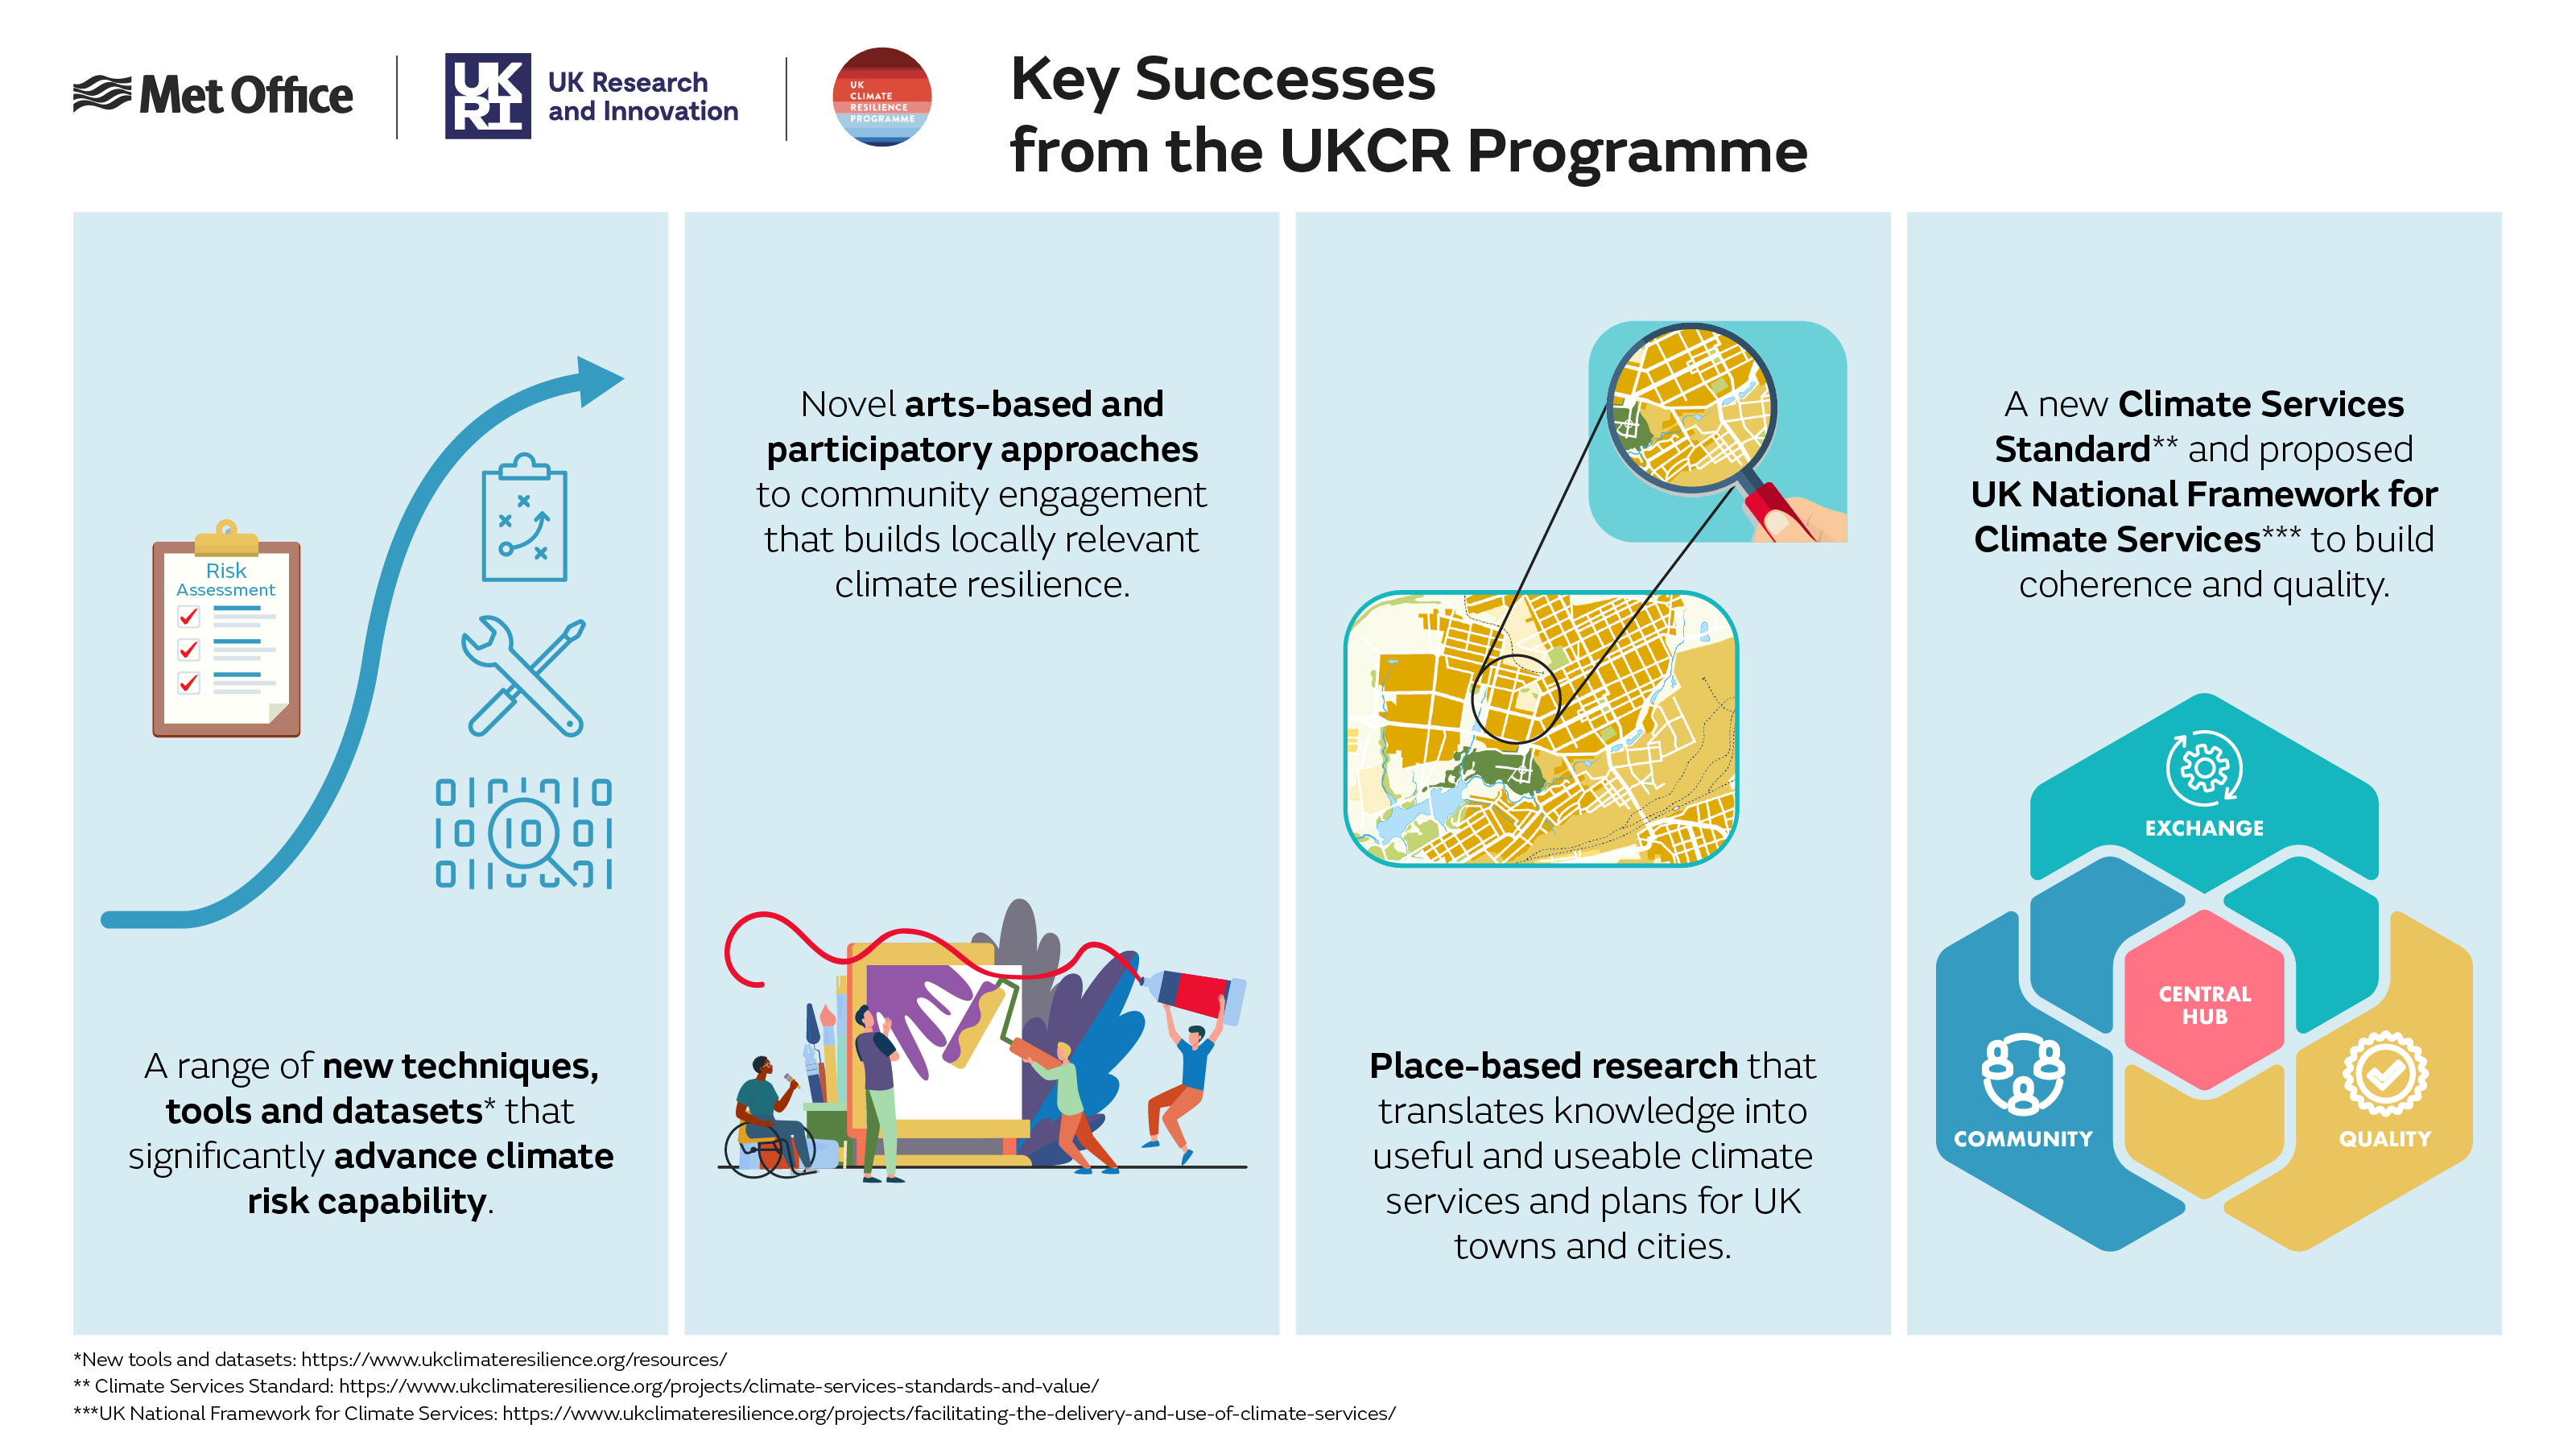
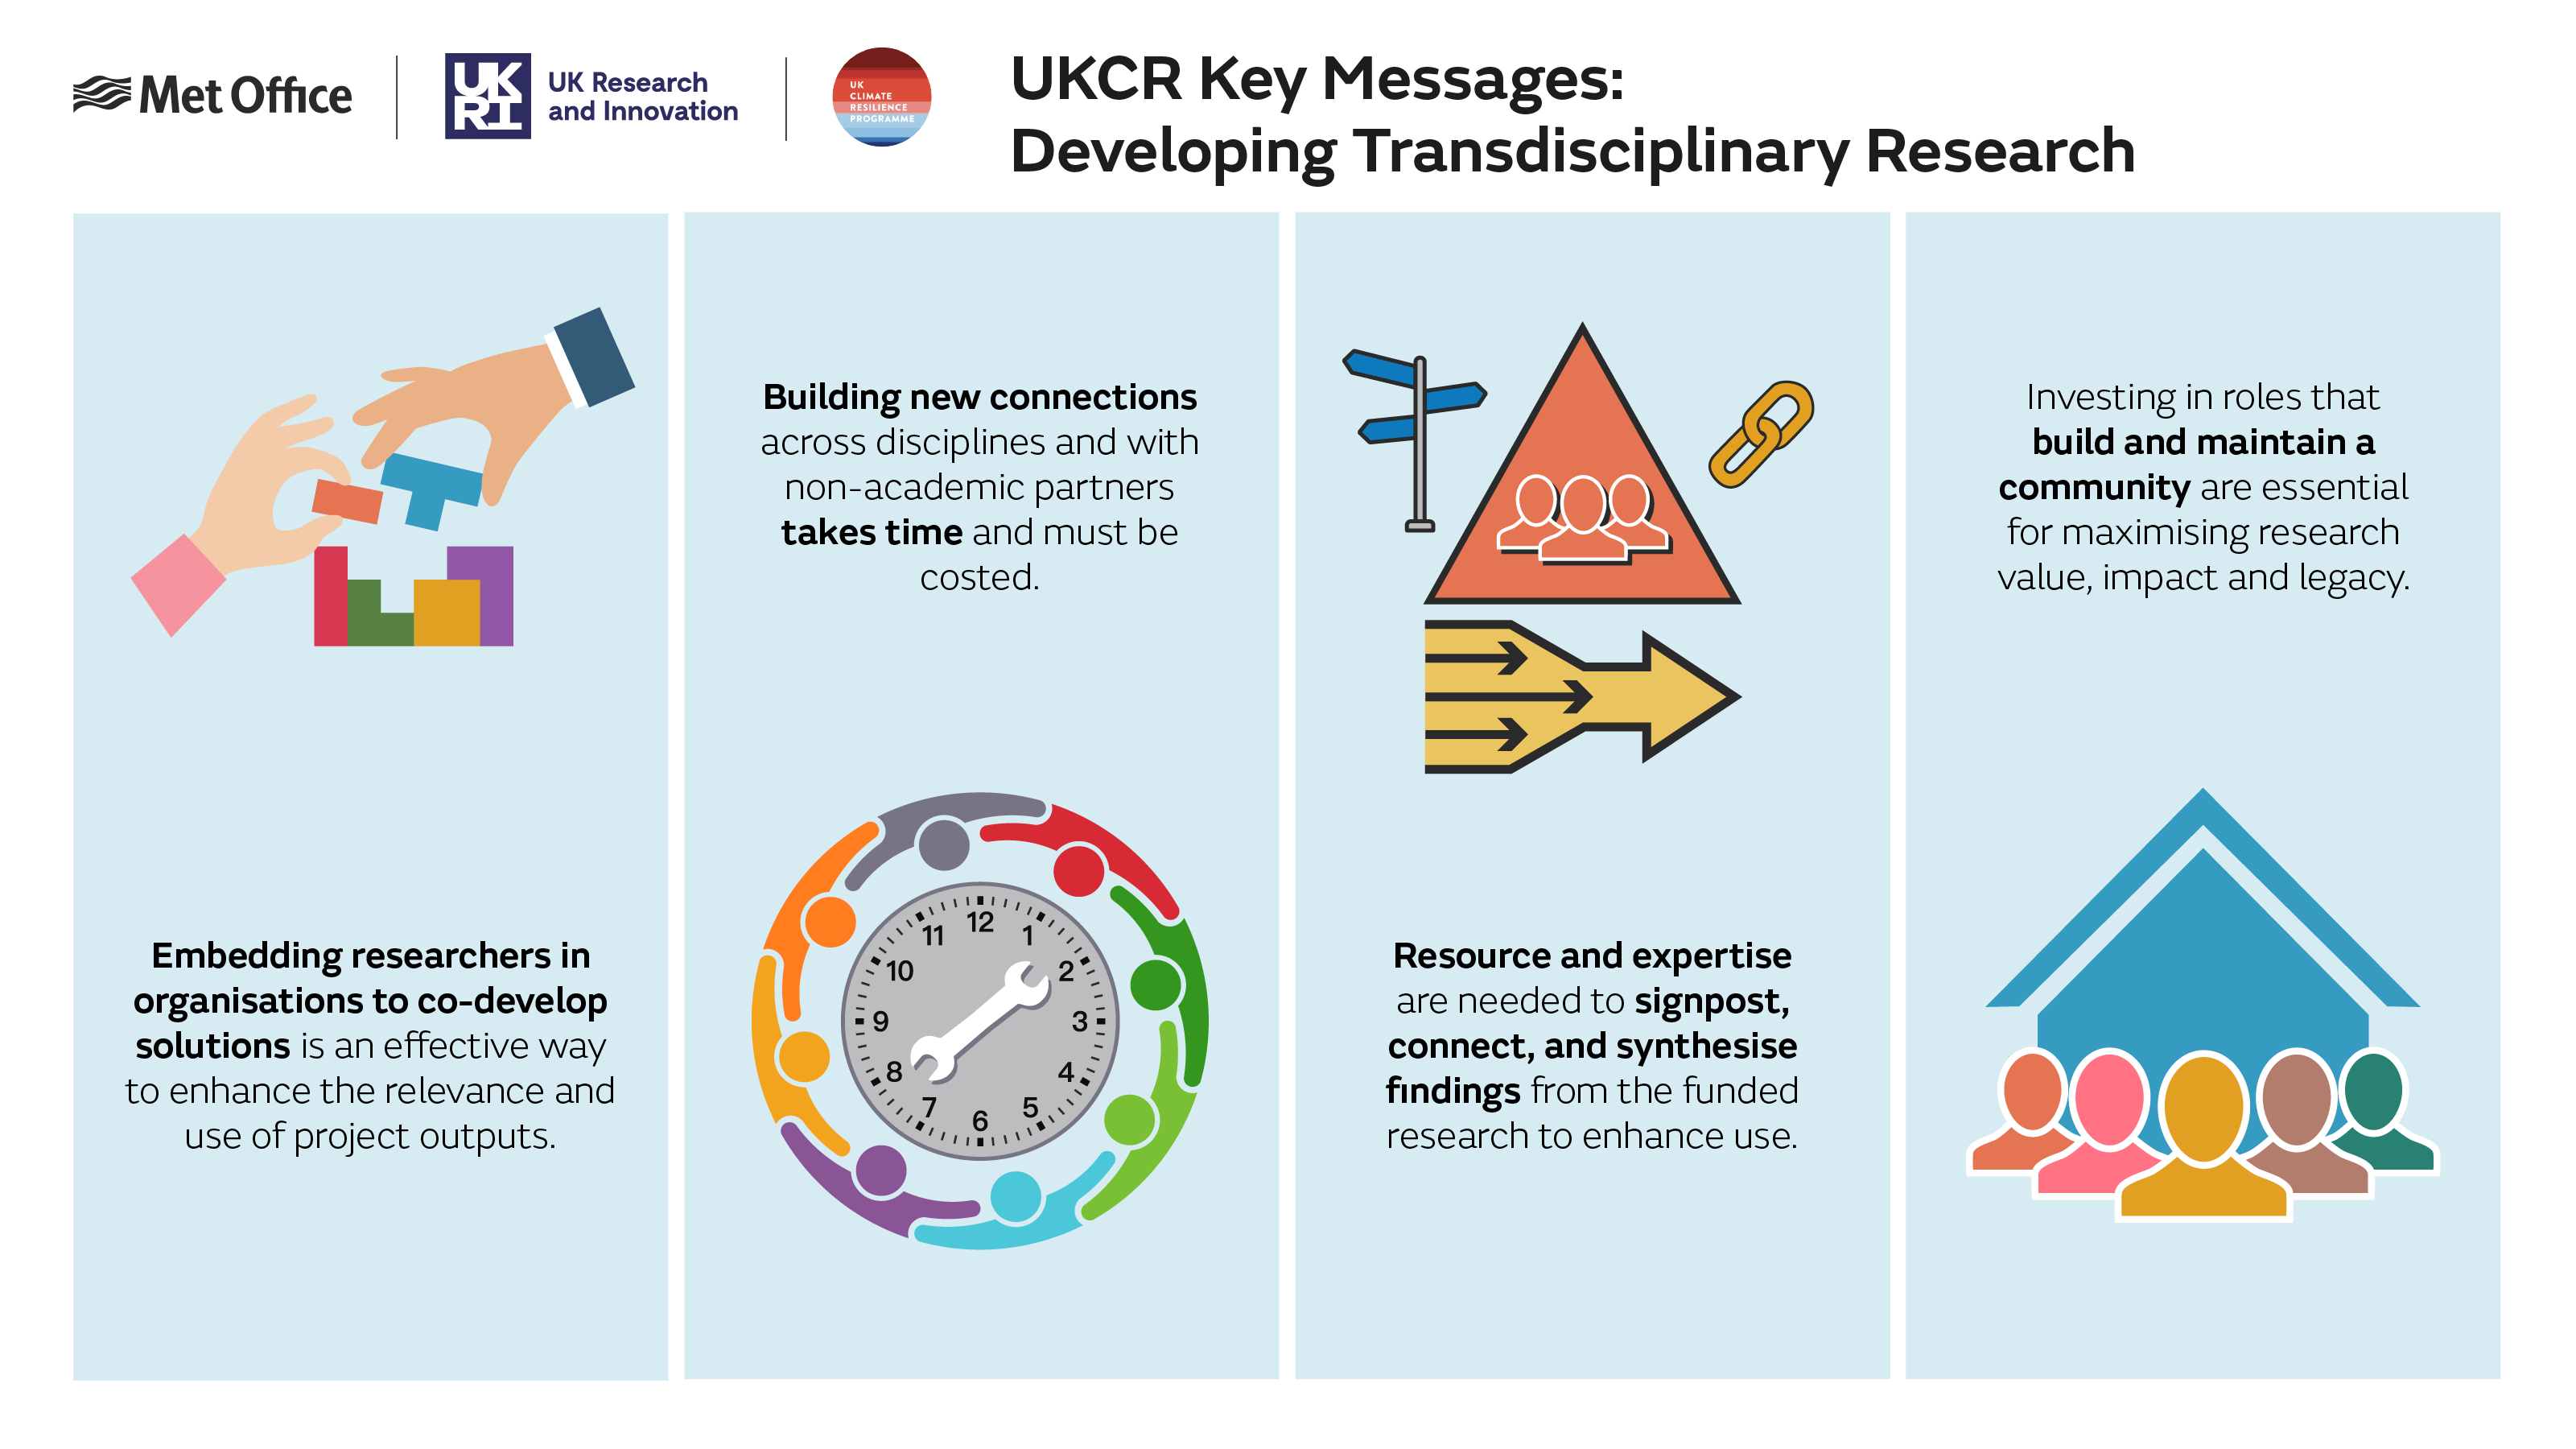
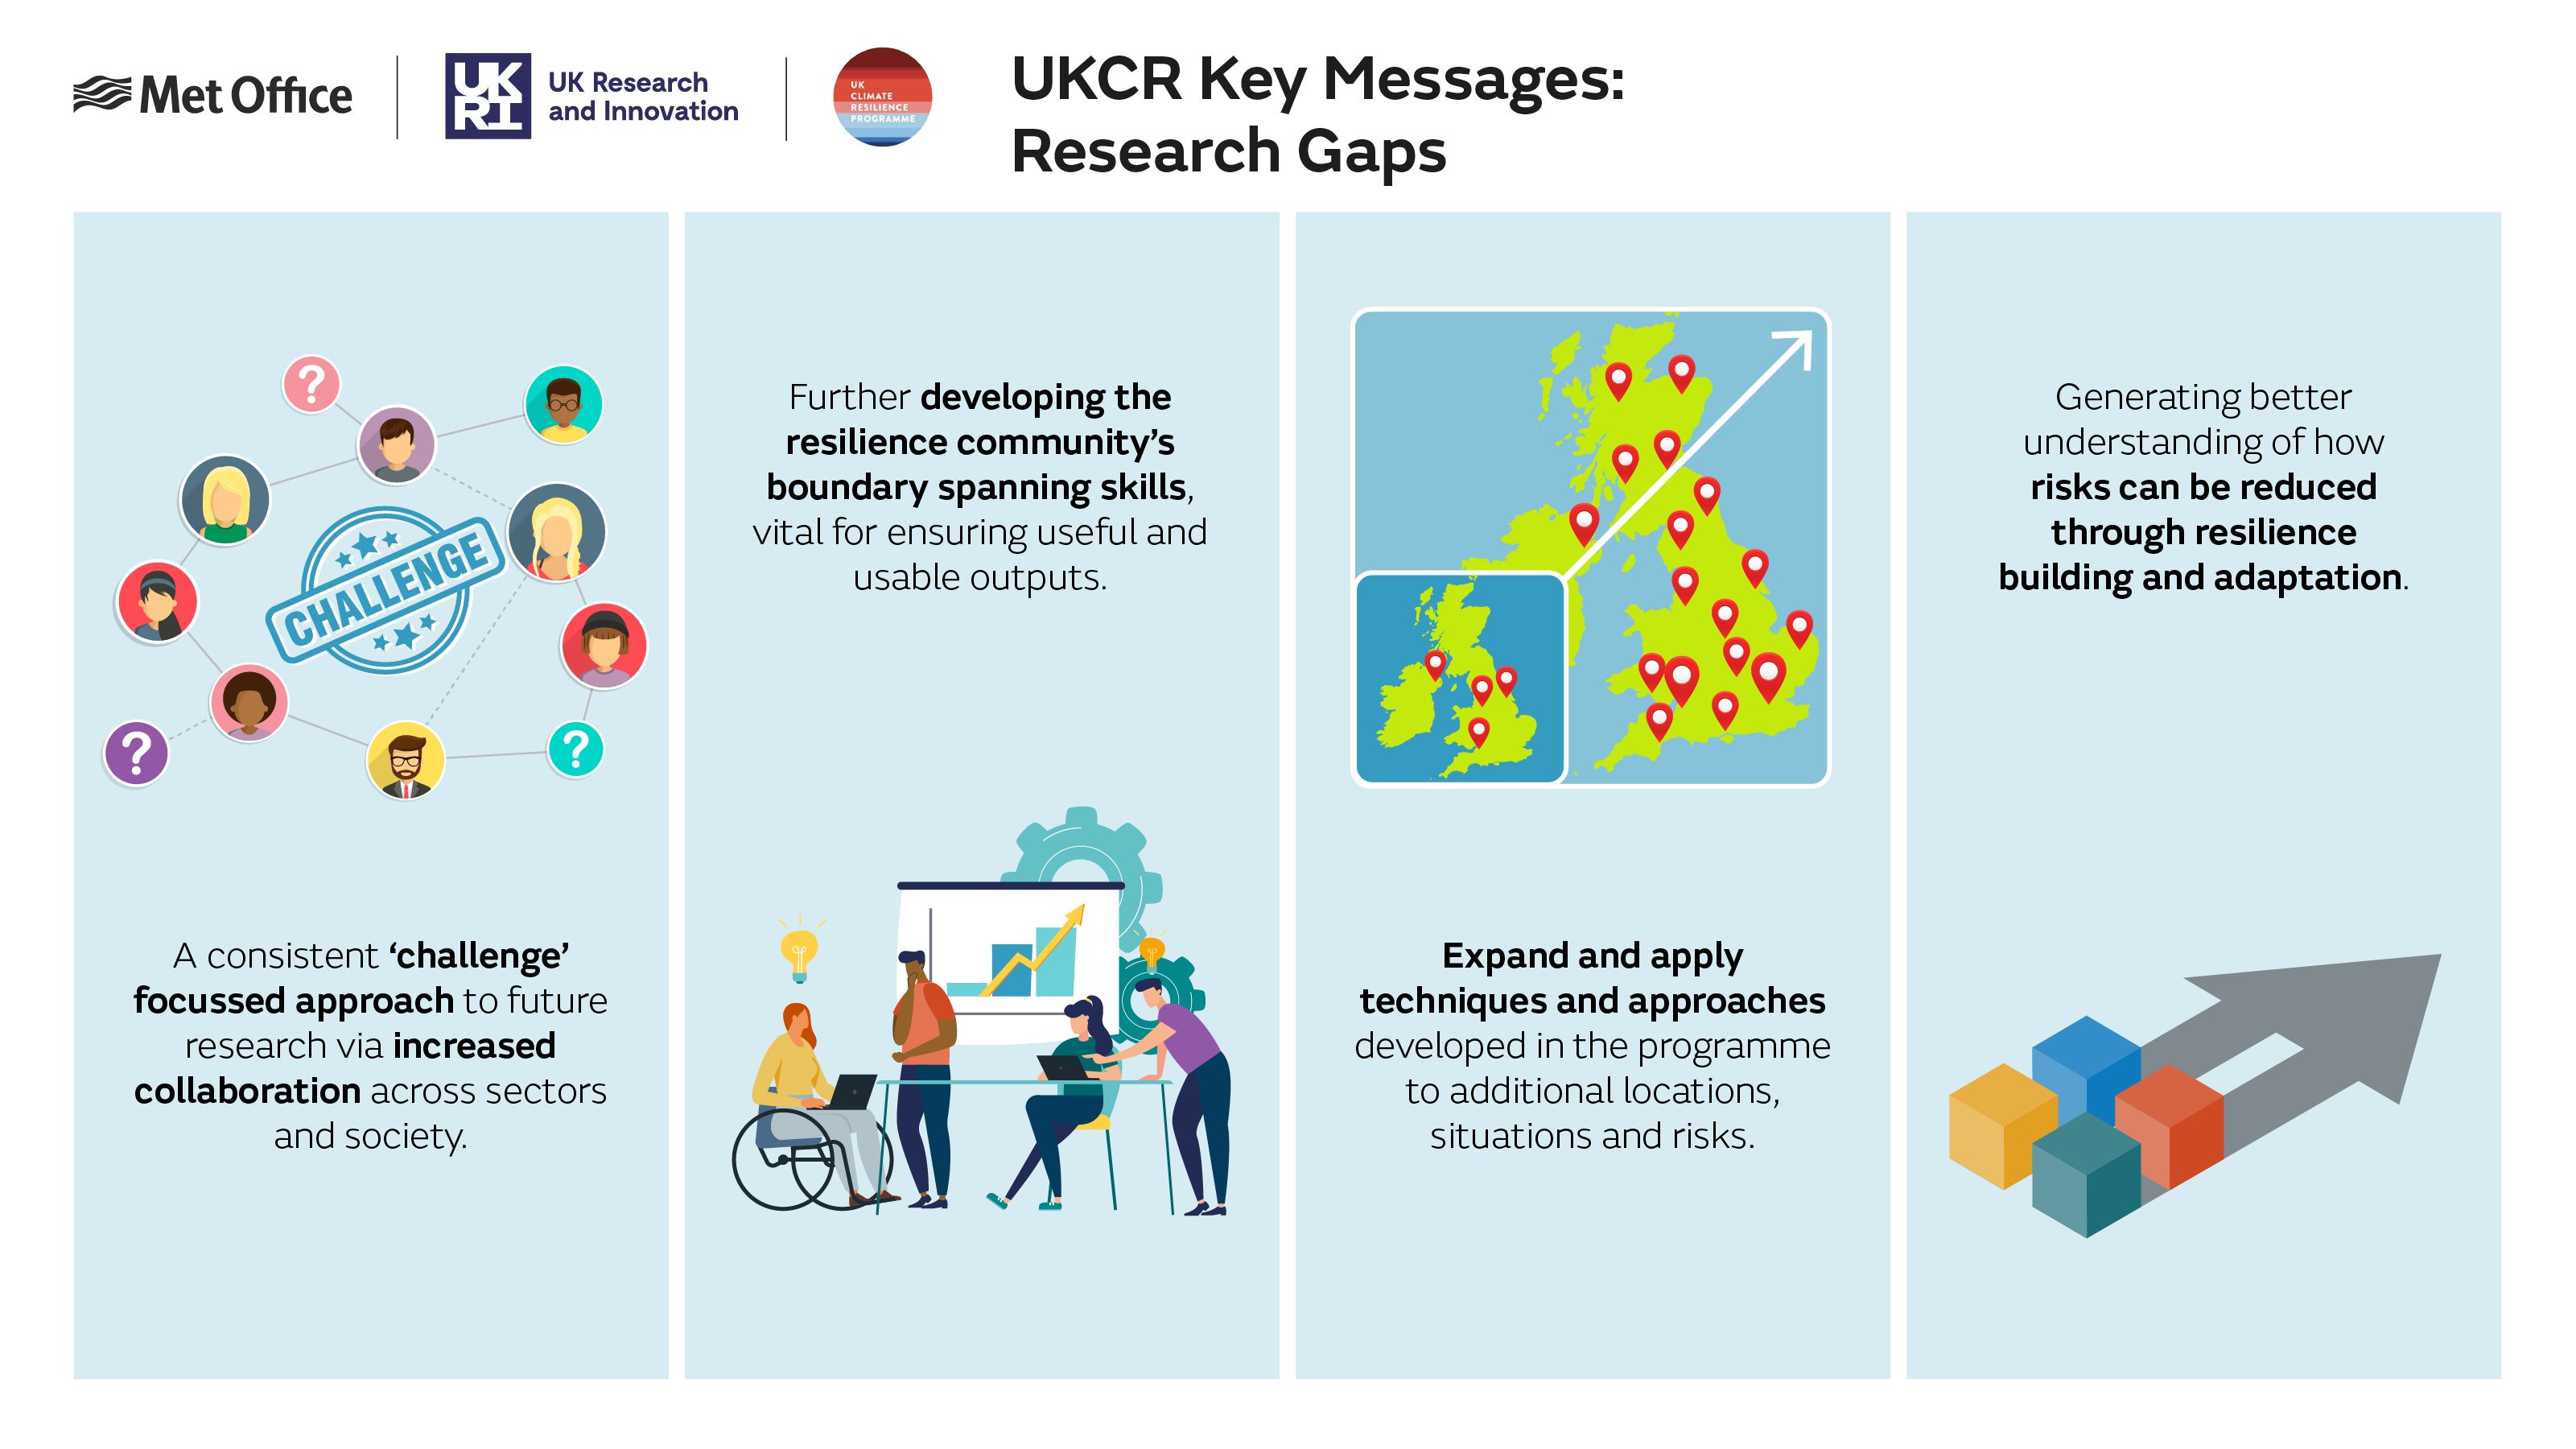
The three infographics below summarise the key successes and messages from the UKCR programme.
