Met Office Hadley Centre observations datasets
Home > HadISDH >

HadISDH.blend Decadal Trends from version 1.5.1.2024f


Trends are calculated using Ordinary Least Squares regression. Gridboxes with borders are where trends are considered to be significant because both the 90pct confidence intervals are of the same sign (positive or negative). These have been calculated with AR(1) correction following Santer et al., 2008. The dark grey coverage across the right-hand-side of panel b) shows the proportion of blend at that latitude band. The light grey coverage shows the proportion of that blend that has observations available.

1973 to 2024 1973 to 1999 2000 to 2024
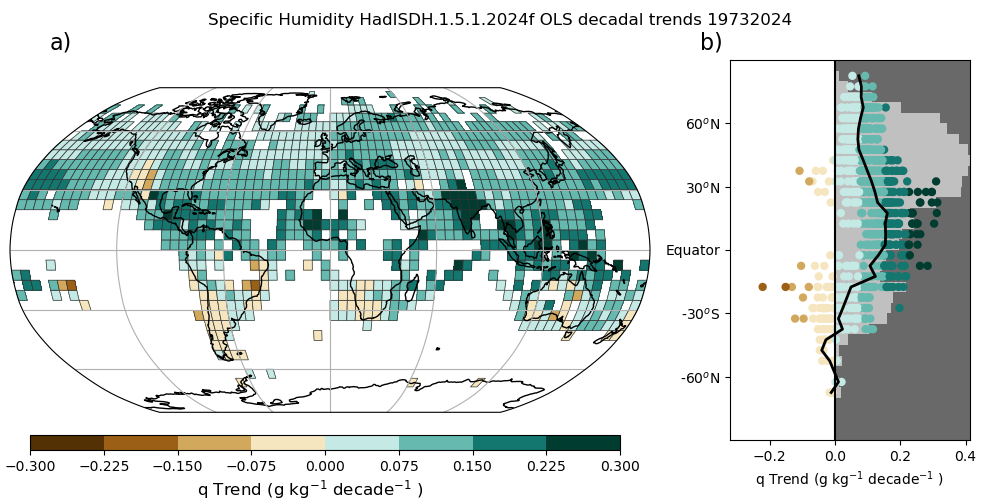
Specific Humidity (q)
1973 to 2024 1973 to 1999 2000 to 2024
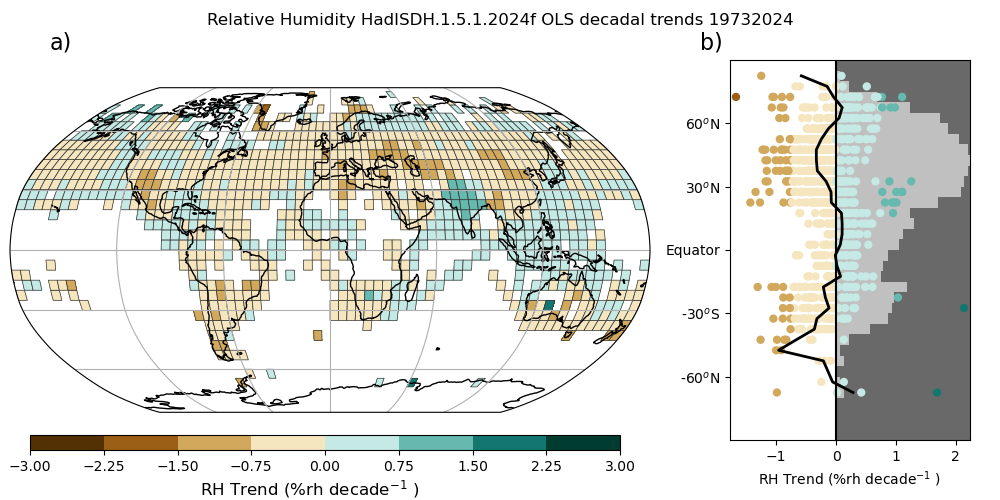
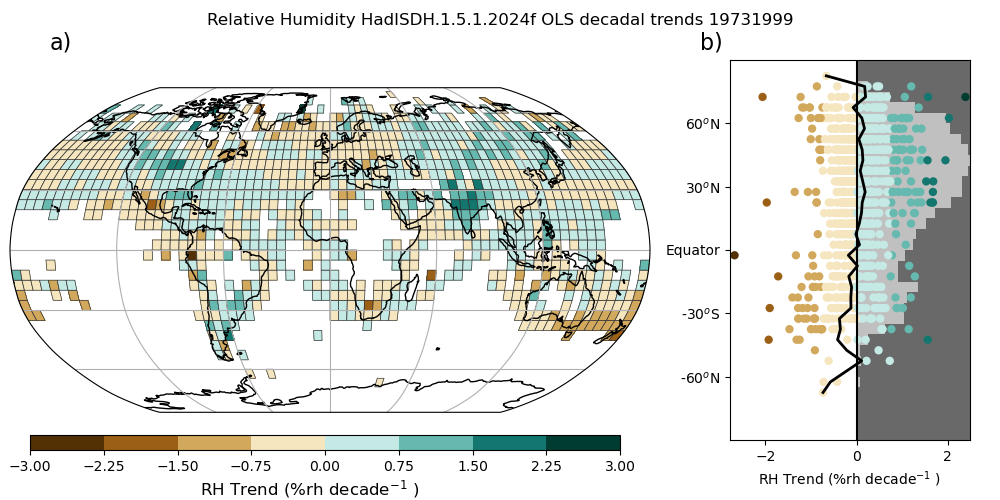
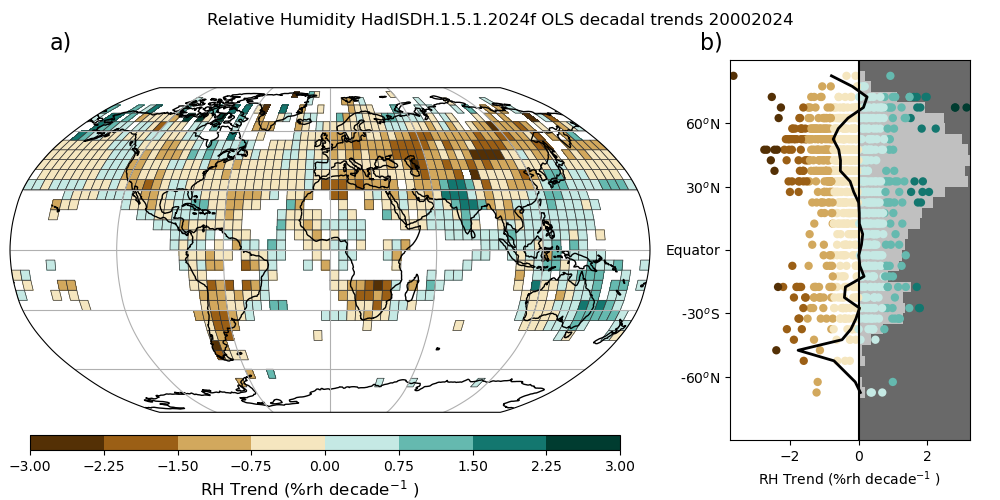
Relative Humidity (RH)
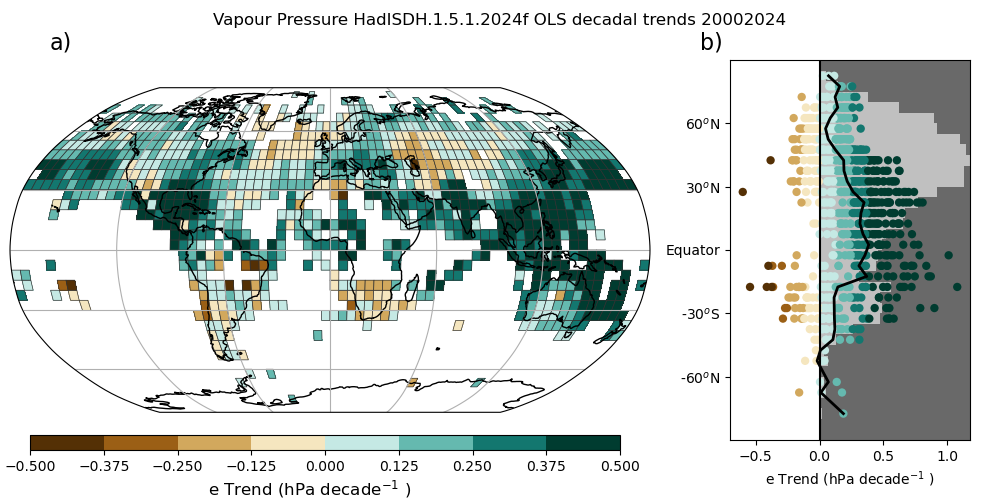
1973 to 2024 1973 to 1999 2000 to 2024
Vapour Pressure (e)
1973 to 2024 1973 to 1999 2000 to 2024
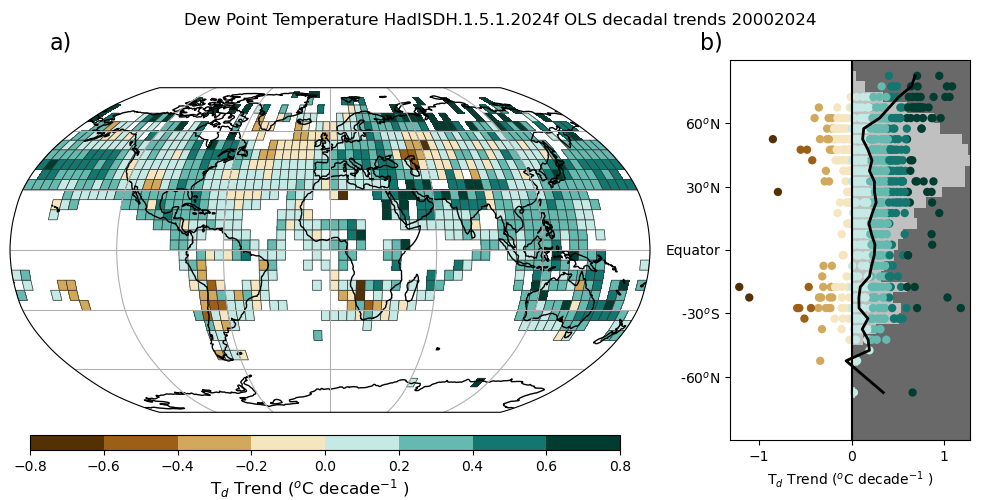
Dew Point Temperature (Td)
1973 to 2024 1973 to 1999 2000 to 2024
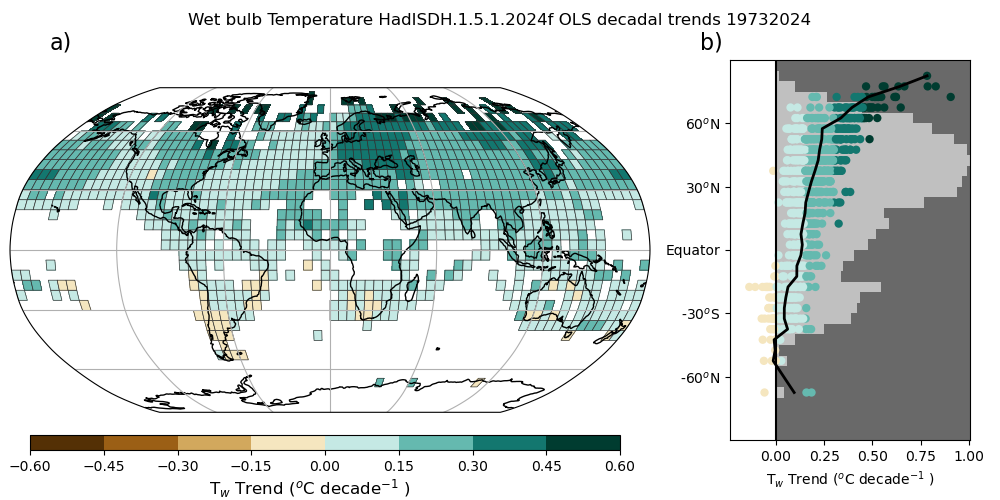
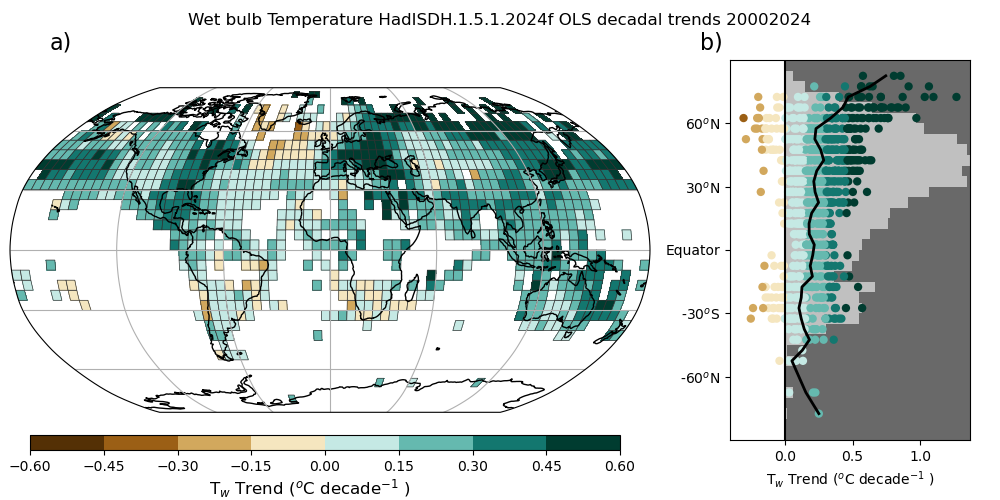
Wet Bulb Temperature (Tw)
1973 to 2024 1973 to 1999 2000 to 2024
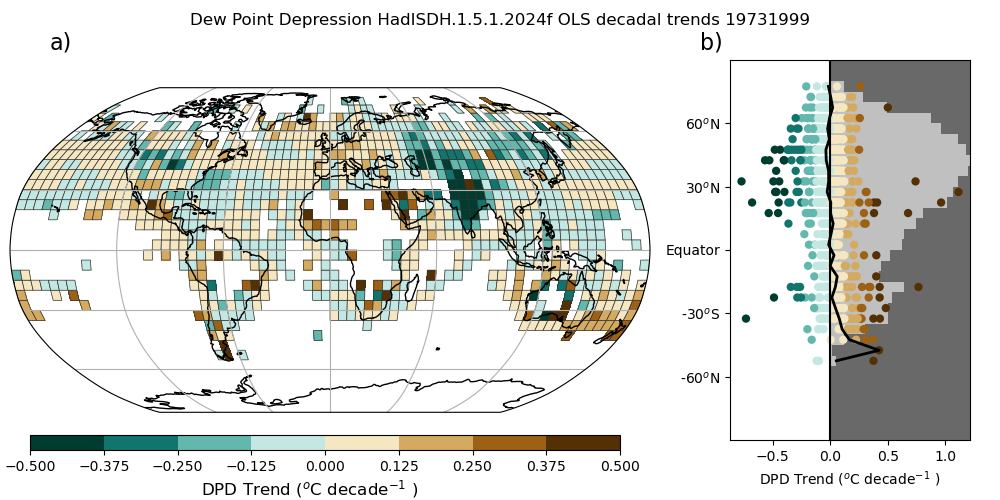
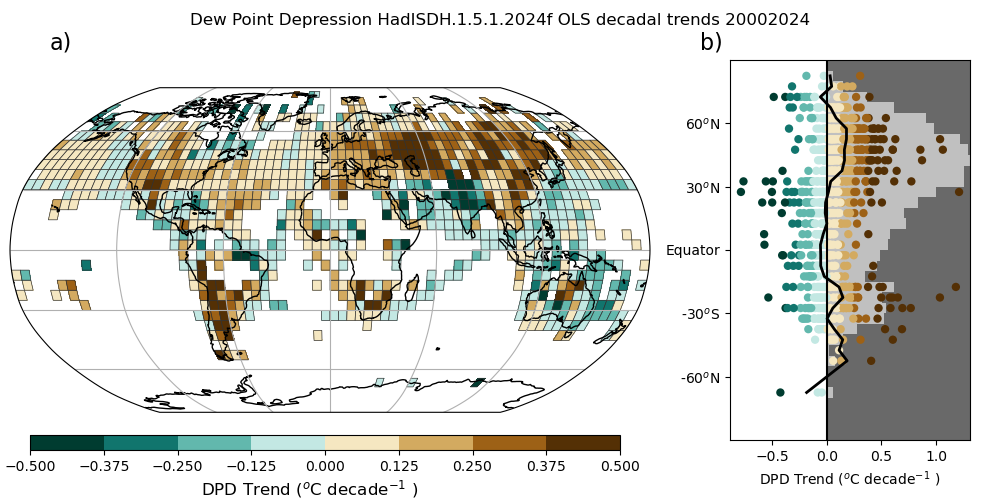
Dew Point Depression (DPD)
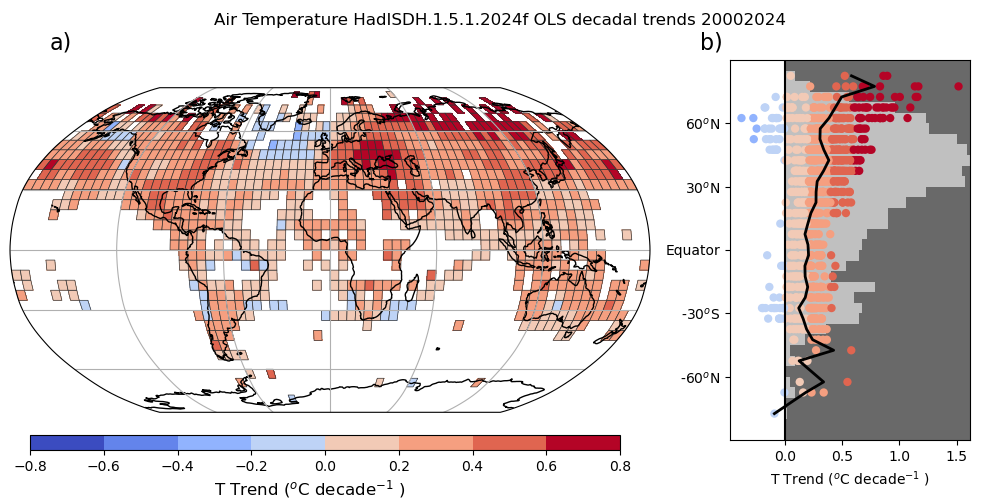
1973 to 2024 1973 to 1999 2000 to 2024
Air Temperature (T)
1973 to 2024 1973 to 1999 2000 to 2024