As COP29 gets underway in Baku, Azerbaijan, the WMO has released its annual update on the State of the Global Climate. This year the report contains an update on the current level of global warming.
Each year at the start of the Conference of the Parties (COP) the World Meteorological Organization (WMO) publishes an update to its annual State of the Global Climate report. This year the update highlights how 2024 is on track to be the world’s hottest year on record, surpassing the previous 2023 record, with 2015-2024 also set to be the hottest decade on record.
Several other metrics used to monitor our changing climate are included in the report, including greenhouse gas concentrations in the atmosphere, ocean heat content, sea level rise and sea ice extent.
A number of global datasets, including the Met Office’s HadCRUT5 dataset, contribute to the temperature section of the report. The consensus of these datasets shows that the January – September 2024 period was 1.54°C above pre-industrial levels (1850-1900).
The annual global temperature values for 2023 and 2024 have been influenced by the strong El Niño, which imparts heat from the Pacific Ocean to the atmosphere, raising annual global temperature by around 0.2°C. The El Niño developed during 2023 and peaked earlier in 2024. While this El Niño event ended in April 2024, the effects of El Niño on global temperature continue to be seen, as is typical following such an event. Annual average warming can go up or down each year because of natural changes, but the overall trend is upwards as a result of human-caused climate change.
While this January – September period surpassed 1.5°C above pre-industrial levels, it is important to note that the long-term warming which is measured over a number of decades remains below the 1.5°C guard rail set by the Paris Agreement.
The importance of monitoring current global warming
Historically, global warming levels have used observed averages over the past 10 or 20 years. While we need to know the level of current warming, these averages are representative of the level of warming five or ten years in the past. This means we would have to wait at least five or ten years to confirm whether important guard rails such as the 1.5°C Paris Agreement have been reached, creating a decade of otherwise preventable delay.
Ahead of COP28 last year, a team of Met Office scientists published a paper assessing a range of methods to indicate current global warming. The intention being to eventually get a universally agreed method that can inform decision making using live data rather than waiting for decades to pass.
This work has continued and now contributes to a WMO Task Force on measuring current warming. Further scientific papers have since been published and an update to this current global warming figure has been included in the WMO State of the Global Climate report published today.
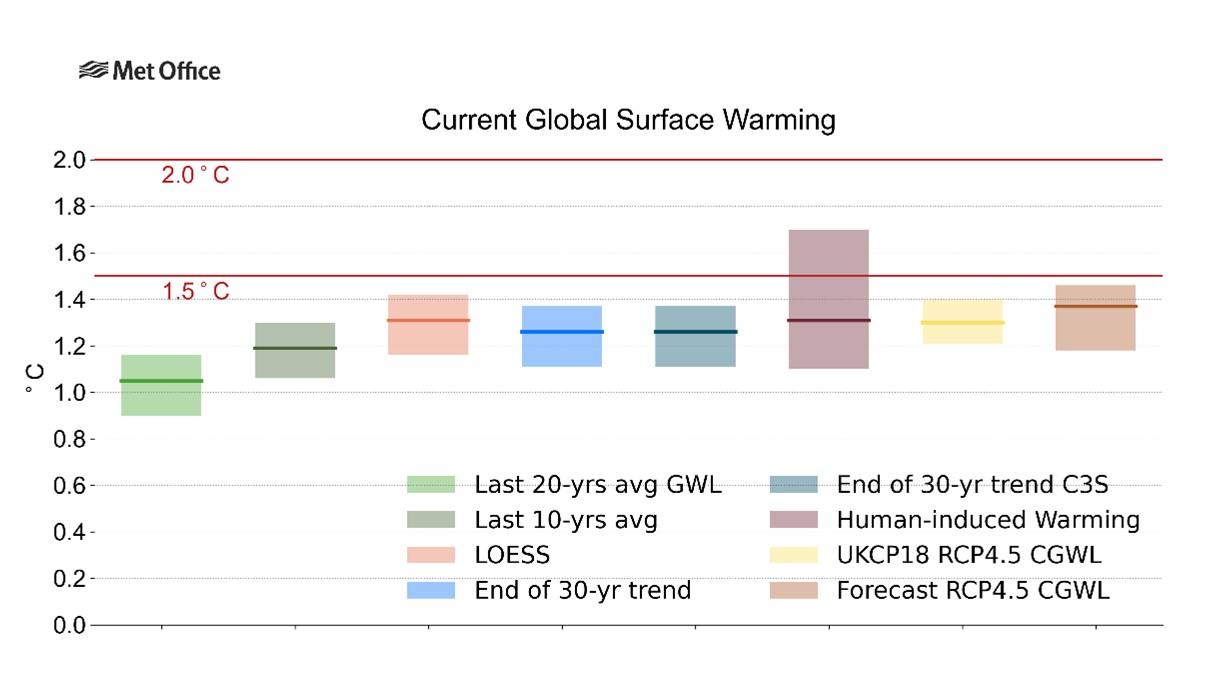
The latest calculations put current global warming at 1.3°C above the pre-industrial period (1850-1900).
Met Office climate dashboard
To help communicate and visualise these new methods, the Met Office added an ‘Indicators of current global warming’ section to the Met Office Climate Dashboard. Here the various methods are explained and the current warming level for each presented in a range of visual graphics. The data is also available to download.
The dashboard has just been updated to reflect the latest update to the indicator methodology and shows the latest current global warming figure.
The graph displayed below shows the current level of global surface warming relative to the pre-industrial era (1850-1900 average) for a range of indicators. The indicator included in the WMO State of the Global Climate report is the dark pink bar, titled ‘Human-induced warming’.


