September 2023 was the world’s warmest September on record for global average temperature according to the Copernicus Climate Change Service. The September average temperature was 16.38°C which is 0.93°C above the 1991-2020 average. This anomaly also made September 2023 the month with the highest difference to average of any month in any year in the ERA5 dataset which dates back to 1940.
The report also states the global temperature for January-September 2023 was 0.52°C higher than average, and 0.05°C higher than the equivalent period in the warmest calendar year (2016). You can read more about this announcement in the Copernicus September Climate Bulletin.
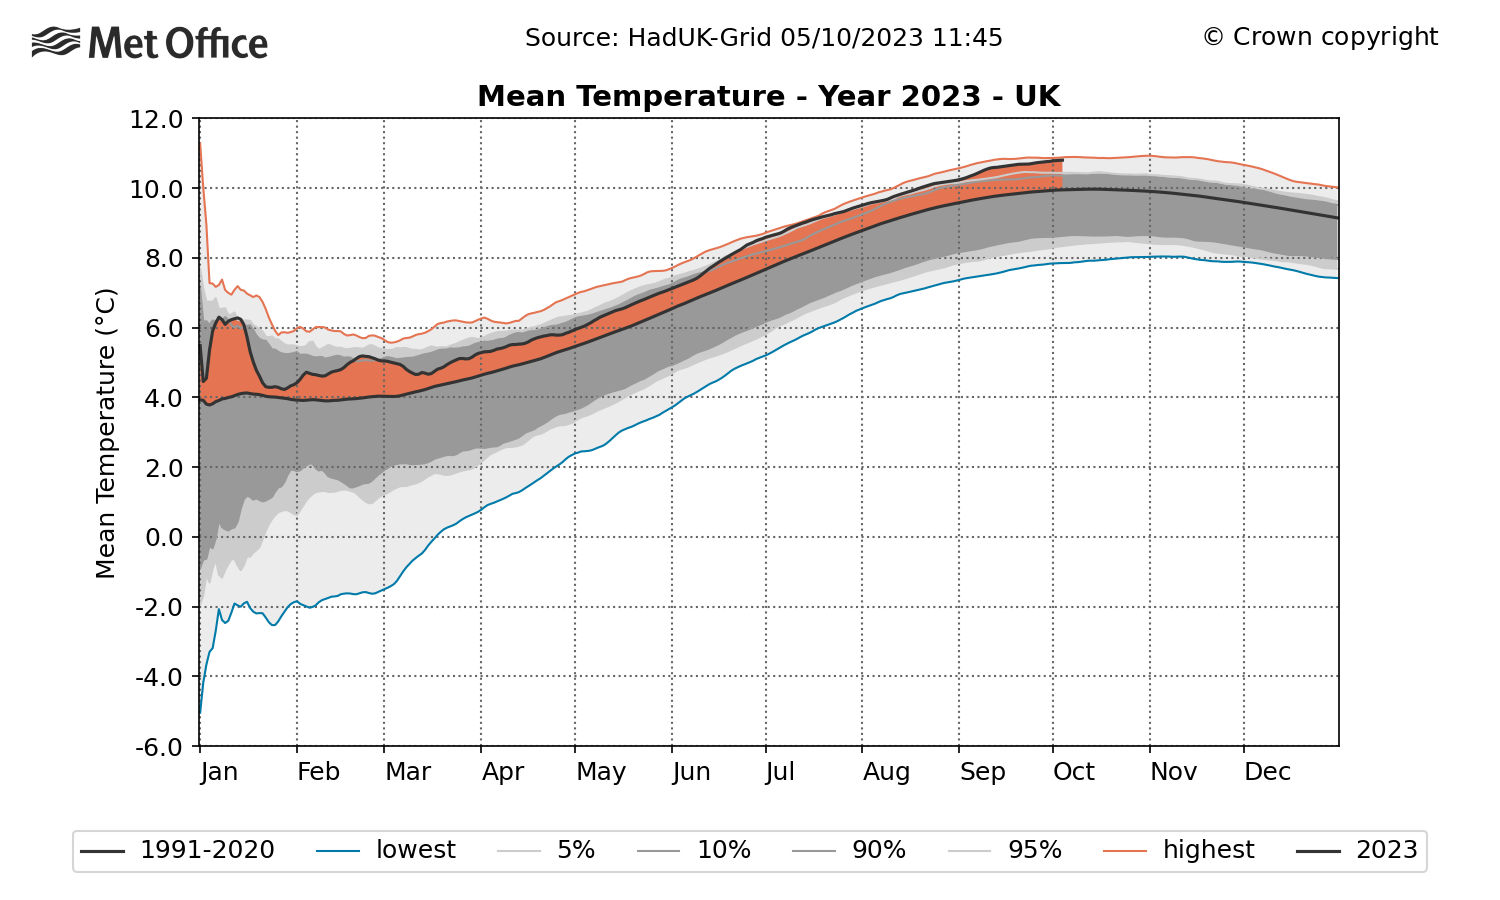
This significant global anomaly leads to the question of where the UK’s climate for 2023 is compared to our observational record. So far for 2023 the first nine months of the year have been the second warmest on record for UK mean temperature, with records dating back to 1884. The mean temperature for the nine month period is 10.8°C, 0.9°C above the Jan-Sept 1991-2020 average.
The warmest UK January-September period on record is 2022, which ended up being the warmest year on record for the UK.
It is important to remember that when looking at smaller areas, such as the UK rather than the whole globe, the statistics become much more sensitive to variability in our weather. So, although the UK mean temperature is currently second warmest, it by no means guarantees that this ranking will be the same by the time we get to the end of the year. The figure will be highly dependent on the regimes that influence the UK’s weather through October, November and December.
The UK’s September climate statistics were published earlier this week, reporting that September 2023 was the joint-warmest September on record for the UK.
Dr Mark McCarthy from the Met Office’s National Climate Information Centre, said: “The first nine months of 2023 have been the second warmest on record for the UK, following only 2022. There are however three months of the year still to go, and our weather in the UK can significantly influence these sorts of statistics. With this in mind, it is still possible that the ranking could change as we get closer to the end of the year.”
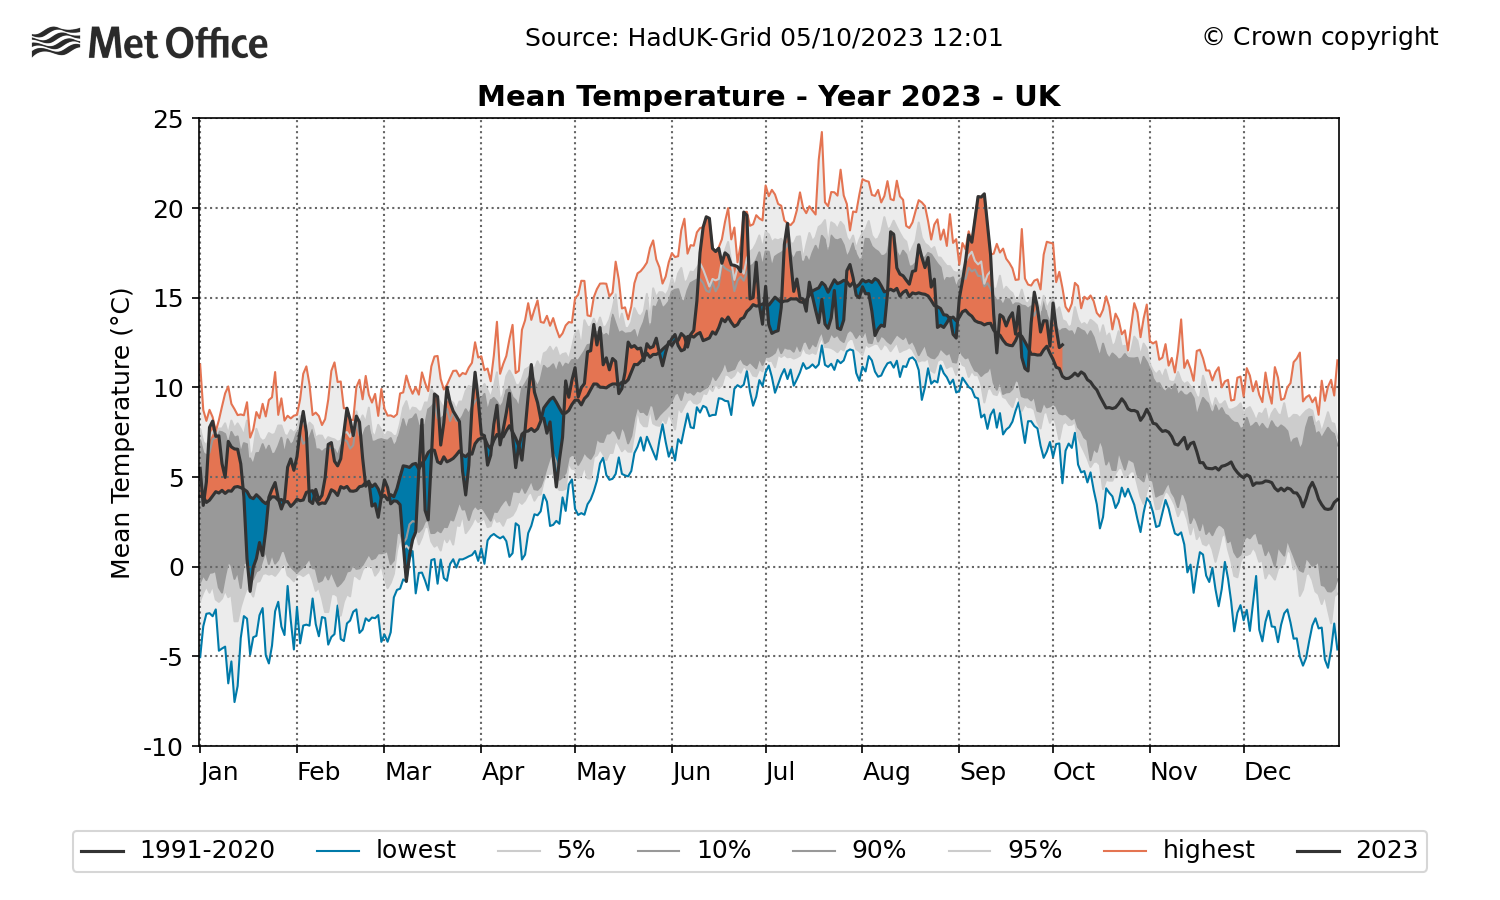
The first graph below shows the UK daily mean temperature for each day of 2023 so far. The central thick black line is the 1991-2020 average UK temperature for each day, while the red and blue shading show spells of above and below average temperature through the year – in particular the warmth in June and early September and colder spells in mid-January, early March and late July to early August. Notably however there is much more red shading than blue meaning that overall the year so far has been warmer than average.
The second graph below shows the average UK mean temperature for 2023 as it has been monitored for the year so far, compared at that point against all other years. This is effectively an accumulation of the shaded areas in the first graph. The lines on this graph tend to smooth out through the course of the year as the averaging period increases in length. The central thick black line is the 1991-2020 average UK temperature, the filled orange line is 2023 so far, with the record breaking year of 2022 sitting just above it.


