This month we are exploring the topic of emissions trends and drivers. Here we take a look at how national emissions are estimated and the relevance of this information for policymakers.
Developed countries have an obligation under the United Nations Framework Convention on Climate Change (UNFCCC) to provide detailed annual summaries of their emissions of the principal greenhouse gases (GHGs): carbon dioxide (CO2), methane, nitrous oxide, hydrofluorocarbons (HFCs), perfluorocarbons (PFCs), sulphur hexafluoride (SF6) and nitrogen trifluoride (NF3).
This official reporting process uses a bottom-up approach based on counting different emission activities (e.g., cars, trains, cows, landfill sites, industrial process etc.), multiplying them by the emissions per activity (e.g., number of cows multiplied by emissions per cow) and summing these numbers per gas to arrive at a country total. There are hundreds of different activities defined, each with their own emission factor per gas.
An approach using atmospheric observations (‘top-down’)
An alternative and complementary approach to estimate GHG emissions is the so called top-down method. This uses precise, high frequency, atmospheric measurements of the concentrations of each GHG combined with a computer model to represent the transport of the gas from source to measurement point.
This method is commonly referred to as inverse modelling. These top-down estimates require complex atmospheric transport models using high quality meteorological data, combined with the atmospheric measurements and inverse models. This alternative method can be used to complement and help improve the reported bottom-up inventory.
The UK was the first country, in 2003, to independently compare their bottom-up emissions data reported to the UNFCCC with top-down methods. Currently very few countries (the UK, Switzerland, Australia and the USA) have this capability, however, as we seek to reduce GHG emissions and reach Net Zero, it will be important for nations to be able to verify their reporting, and for the international community to have confidence in the reporting of emissions from all nations.
The UK GHG observations network
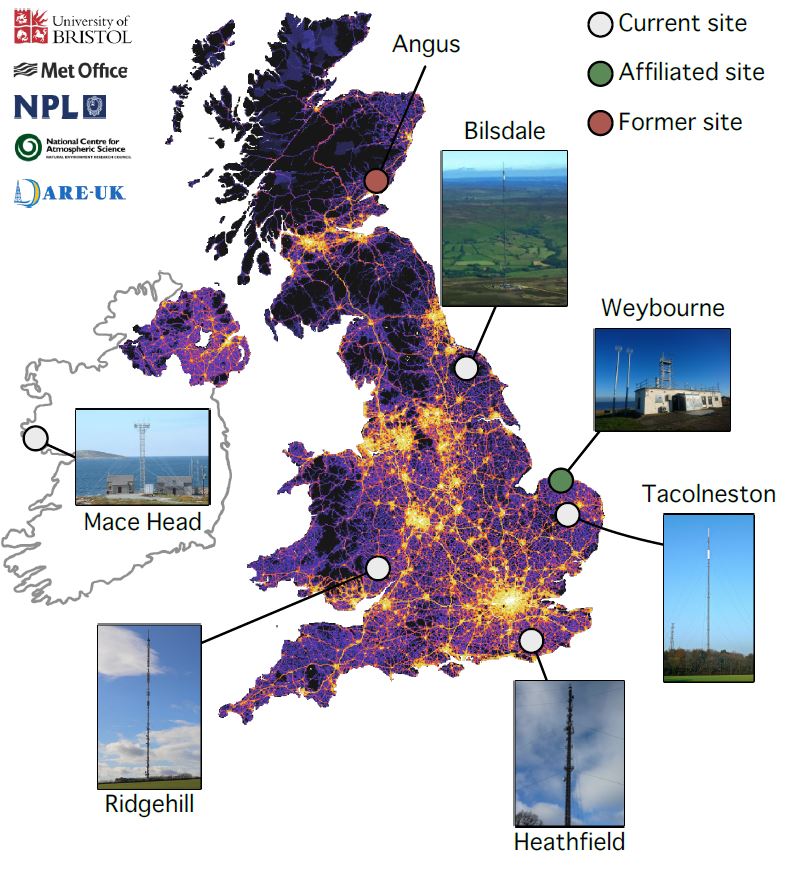
The UK GHG observation network is shown in Figure 1 below, along with the Mace Head site in Ireland. This network is currently being expanded with a new site in Scotland and one in north-west England. Most of the sites are based at tall-tower (90m – 250m) telecommunications stations which allows them to sample well-mixed air from a wide area.
This network is referred to as the UK DECC (Deriving Emissions related to Climate Change) network and is discussed in detail in the paper Stanley et al. 2018. It is funded, along with the top-down modelling, by the UK government through the Department for Energy Security and Net Zero. The top-down estimates also make use of the GHG observations from across the European continent.

Figure 1: UK GHG tower observation network. The UK map shows the reported CO2 emissions from one year as an example. Brighter colours indicates larger emissions.
Model development
The top-down method used in UK reporting is called an Inversion Technique for Emission Modelling (InTEM) and has been developed over the last two decades by the Met Office (model details can be found in the paper Manning et al. 2021). The model essentially tries to find a geographical distribution of emissions, for each different gas, that allows it to best reproduce the observations for that gas, recorded at the different measurement stations. These emissions are then summed up across the country and compared to the bottom-up inventory.
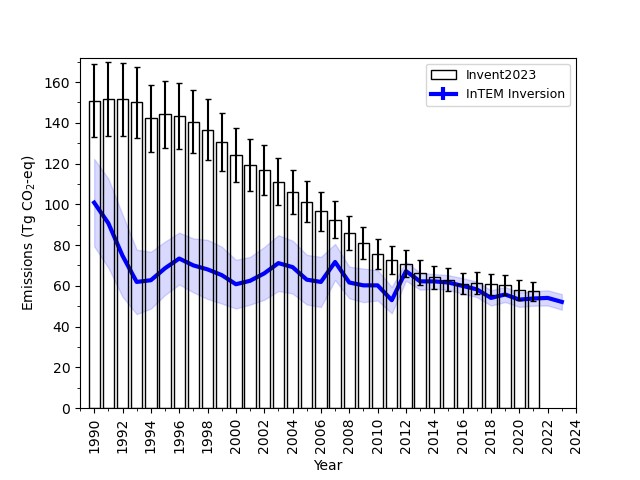
An example of this is shown in Figure 2 for UK methane below, with the bottom-up inventory shown as black bars, and the top-down InTEM estimate shown as a blue line.

Figure 2: UK emissions of methane (CH4) in Tg CO2-equivalent from 1990 as reported to the UNFCCC in 2023 (bars) and the estimates from InTEM (blue line), an atmospheric observation derived estimate. Uncertainties are to 1-sigma.
Alistair Manning, Scientific Manager at the Met Office, explains, “There is very good agreement between the bottom-up and top-down estimates from 2012 onwards, both showing a slowly declining trend, however there are significant disagreements in the 1990s and 2000s. This mismatch is currently under investigation and could be caused by a range of factors in both the top-down and bottom-up methods, which have both been developed significantly in more recent years. Such disagreements are used by the inventory community to help direct their efforts to continually improving the reported inventory values.”
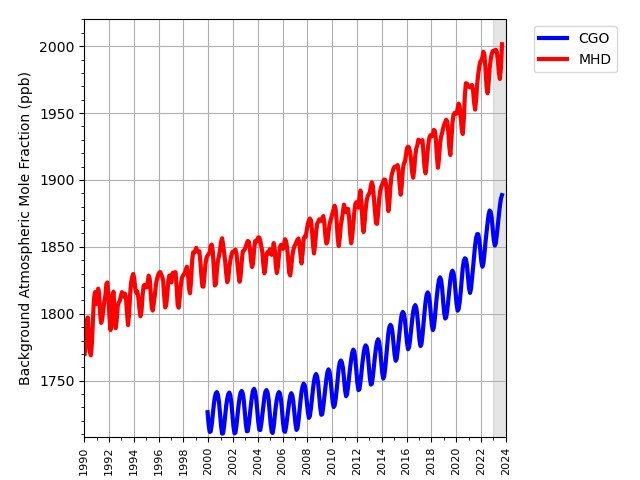
As part of the top-down modelling process, the northern hemisphere and southern background concentrations of each gas are estimated, as shown for methane in Figure 3 below. This example highlights the increasing concentration of methane in both hemispheres and also reveals that the majority of the emissions are in the northern hemisphere, as shown by the lower southern hemisphere concentration, driven by the slow mixing between the hemispheres.

Figure 3: Well-mixed northern (red) and southern (blue) hemisphere concentrations of methane measured at a remote site on the west coast of Ireland (MHD) and north-west Tasmania, Australia (CGO).
Value to policymakers
Understanding the impact and effectiveness of policies on the atmospheric abundance of GHGs is vitally important to policymakers to demonstrate the effectiveness of their policies. This type of top-down independent emissions verification is considered good practice by the Intergovernmental Panel on Climate Change (IPCC, 2019) as it assists inventory compilers by identifying inconsistencies between the two approaches, thereby having the potential to improve the accuracy and reduce the uncertainty in nationally reported inventories.
A benefit of the top-down method is that the estimates are available faster (3-6 months behind real-time) than the bottom-up estimates, which take up to two years to publish. There remain considerable scientific challenges in this field of research, a key one being that carbon dioxide, the most significant GHG, is very difficult for top-down methods to model due to the significant complications of the natural biosphere. This remains a key research challenge.


