The global sea surface temperatures for both April and May were the highest on record for those calendar months in a series stretching back to 1850. That is according to the HadSST.4.0.1.0 dataset compiled by the Met Office.

With the expected continued warming of the eastern tropical Pacific because of the emerging El Niño, it is likely that global sea-surface temperatures will challenge more records this year.
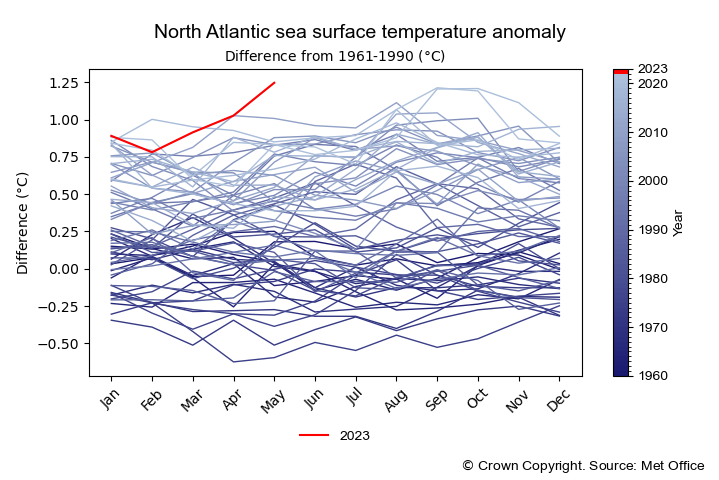
When you look at regional examples, the picture becomes even more stark. The temperature rise in the North Atlantic through May 2023 is record breaking.

The red line shows the sea surface temperature by month for 2023. The other lines indicate years back to 1960. Source Met Office
The month was clearly the warmest May on record since 1850, with temperatures about 1.25°C above the average over the reference period of 1961 to 1990. This difference relative to the reference period is known as the anomaly. May 2023 has seen nominally the highest anomaly of any individual month in the series.
What is driving this record-breaking heat at the ocean surface? Well, it is the classic combination of the underpinning of human-caused climate change with a layer of natural variation within the climate system on top. Climate change – driven by rising greenhouse gas emissions from fossil fuels, industry and land use changes – continues to warm the surface of the planet, both land and ocean. However, natural variation – including the warming and cooling phases of El Niño and La Niña respectively – creates modest deviations in the baseline global temperature that is rising overall because of climate change.
Professor Albert Klein Tank is the head of the Met Office Hadley Centre. Commenting on the situation in the North Atlantic, he said: “Typically, airborne dust from the Sahara helps to cool this region by blocking and reflecting some of the sun’s energy; but weaker than average winds have reduced the extent of dust in the region’s atmosphere potentially leading to higher temperatures.
“Additionally, lighter-than-usual trade winds could be playing a role.
“All of these elements are part of natural variation within the climate system which are coming together to elevate sea-surface temperatures to higher levels. It is not believed that these factors represent a climate-change-induced tipping point that produces runaway temperatures. However, they will add to climate and weather impacts this year.”
Climate scientists are also reviewing a number of other factors including: the warm phase of the Atlantic Multi-decadal Oscillation since 2020; reduced emissions from shipping; and a persistent weather pattern with easterly winds from the continent warming the sea surface.
What impacts will stem from elevated Atlantic sea-surface temperatures?
The eastern tropical Atlantic is the principal spawning ground for North Atlantic hurricanes. Meteorological records show that during periods influenced by El Niño that the development of hurricanes is suppressed in the north Atlantic because wind shear – winds crossing at different heights – tend to blow fledgeling hurricanes apart. However, forecasters have had to take into account the rise in sea-surface temperature as tropical cyclones derive their energy from warmer waters. The forecast this year from the Met Office suggests an above average season for the number of tropical storms and cyclones in the North Atlantic basin.
Julian Heming is a tropical cyclone expert with the Met Office. He said: “We are getting indications from models of an Atlantic tropical storm development east of the Caribbean by the middle of next week. This would be highly unusual in this area so early in the season. June storms normally form further west in the Caribbean or Gulf of Mexico. The high sea-surface temperatures in the tropical Atlantic would likely be one of the main factors if this development did happen next week.”
Arctic and Antarctic sea ice
The Met Office has today [Friday 16 June 2023] published its latest report on the state of polar sea ice.
The report finds that Arctic sea ice extent is well below average for the time of year, but still above record low levels following near-average ice loss during May.
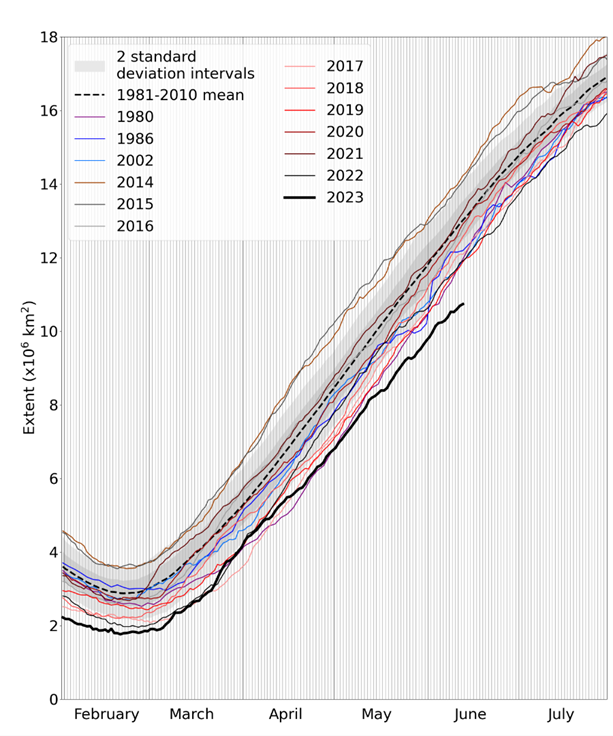
However, Antarctic sea ice extent is exceptionally low, the lowest on record for this date by a wide margin.

Daily Antarctic sea ice extent for 2023, compared with recent years and the low ice years of 1980, 1986 and 2002. Also shown is the 1981-2010 average with ± 1 and 2 standard deviation intervals indicated by the shaded areas. Data are from the National Snow and Ice Data Center (NSIDC).
Dr Ed Blockley is the lead of the Polar Climate Group at the Met Office. He said: “ Over recent decades we have seen a sustained loss in Arctic sea ice extent in every month of the year, but especially in late summer to early autumn. Although the current Arctic sea ice extent is considerably higher than the record low for the time of year, it is still well below the long-term average. Antarctic sea ice has been at very low levels since November 2016. This year we have seen Antarctic sea ice shrink to a record low-point for the time of year, following a second successive annual record minimum sea ice extent in February.”
The current low Antarctic sea ice extent, and recent record lows, are likely partly associated with unusually low sea level pressure in the Amundsen Sea. The ongoing period of low Antarctic sea ice has been linked to oscillations in tropical Pacific sea surface temperatures and Southern Hemisphere atmospheric pressure via El Niño and the Southern Annular Mode – a major feature of climate variability in the higher latitudes of the southern hemisphere.


