With 1 June marking the first day of meteorological summer, we reflect on spring and ask whether it has been unusual in any way.

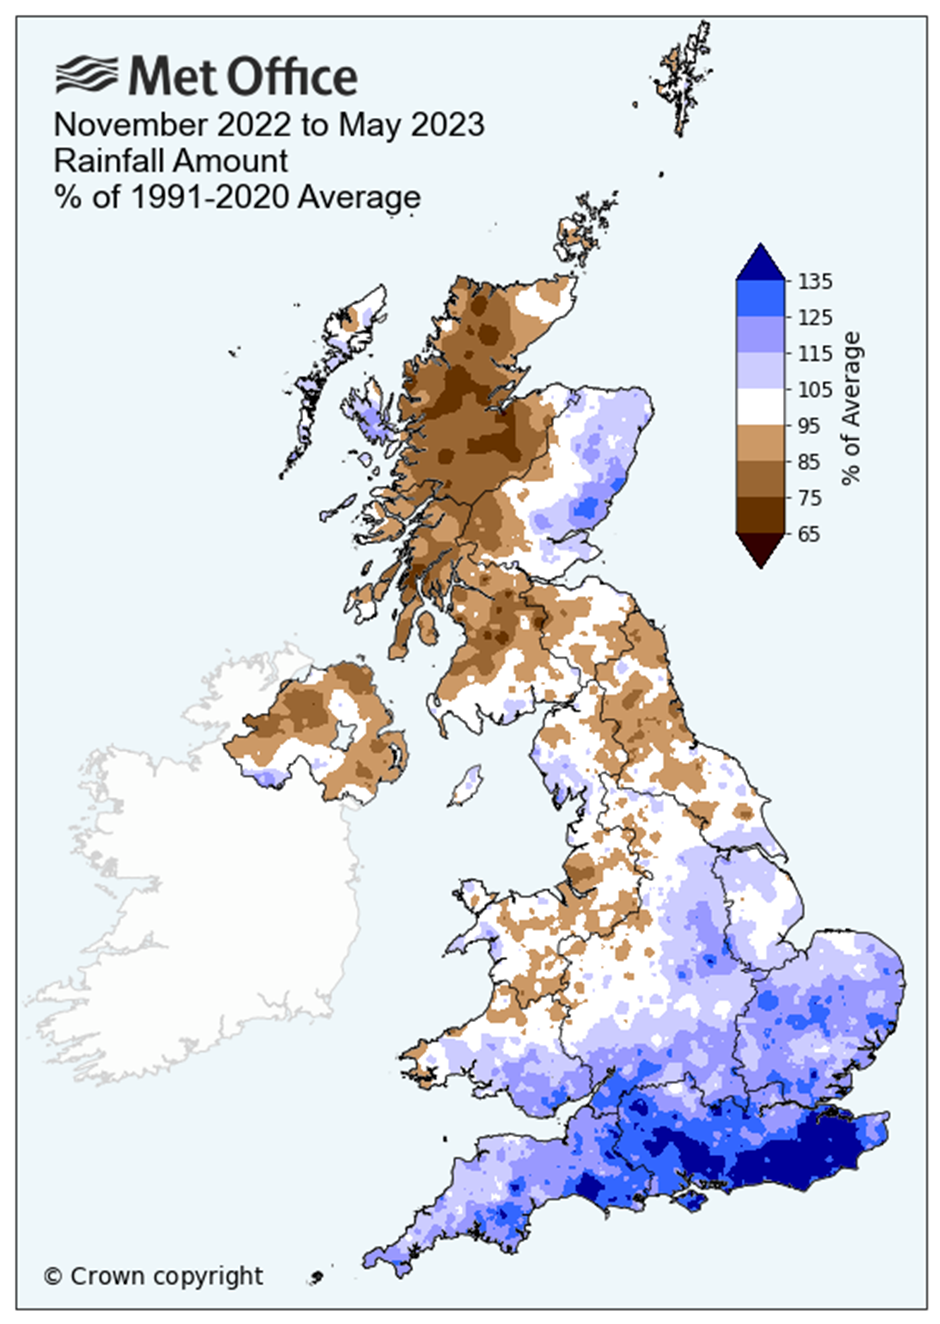
This map of the UK shows the rainfall over from November 2022 to May 2023 (inclusive) compared with average. The blue areas have experienced above-average rainfall for the seven-month period, whereas the brown shaded in brown have experienced below-average rainfall. The white areas of the UK have seen broadly average rainfall.
To fully appreciate what spring has been like we need to put it into context by casting our minds back to winter; a season traditionally regarded as a recharge period for the UK’s water supplies. UK rainfall over winter was down compared with average, with only 83% of average rainfall being recorded for the UK. This relative shortfall in a key period fuelled hopes for more rain to come for spring. Did it? Well, yes and no.
Spring rainfall across the UK has been very slightly above average (106%). But as always with averages, examining the detail can reveal interesting patterns. England has enjoyed well above average rainfall, with counties like Cambridgeshire recording around 161% of what they would in a typical spring. While the rain fell in England, especially during a very wet March, parts of Scotland – including Inverness and Sutherland – have only recorded just under two thirds of their expected rainfall (64%). This is the driest spring in North Scotland since 2018.
Spokesman for the Water Scarcity team at the Scottish Environment Protection Agency (SEPA), Stephen McGuire, said: “Spring and Summer are crucial times of year for water demand and SEPA started regularly reporting on water scarcity at the end of April. Initially, there were early warnings of water scarcity in the north and west of the Scotland with rainfall and river flows low for the time of year. But in recent weeks we have experienced more rapidly drying conditions and river levels are now very low across much of the Scotland.
“We have already issued alerts for water scarcity in the northwest and south central areas, and with little rain in the immediate forecast we expect the situation to escalate quickly and extend across a much wider area in the coming weeks. SEPA will continue to report weekly on the emerging situation.”

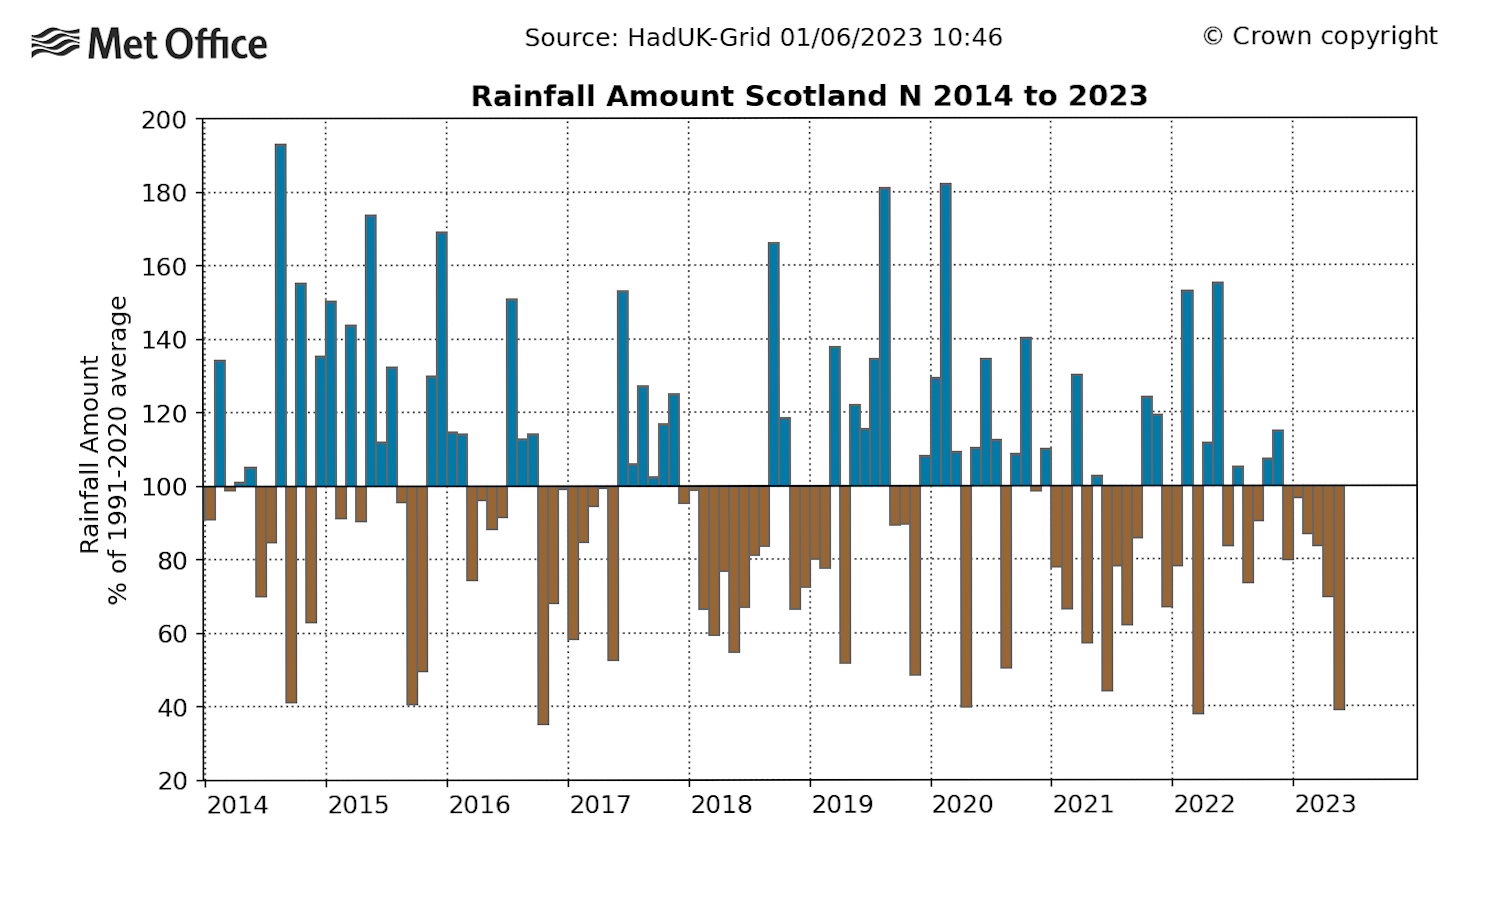
This graph shows rainfall amounts for the Northern Scotland region over the last ten years. The descending brown bars show below-average rainfall per month while the ascending blue bars show above-average rainfall.
Spring temperature has been remarkably ‘average’ across the UK, but again the general picture masks lots of detail. After a colder-than-average start to spring, bouts of warmer conditions have helped to balance the books to bring values to average. Mean temperature for the UK has been 8.36°C; just over a quarter of a degree above the long-term average between 1991 and 2020.
It is worth noting that this spring is one of only three since 2000 where the hottest day of the year reached or exceeded 25.0°C on 29 May or later. This spring we saw 25.1°C at Porthmadog on 30 May. In contrast eight springs since 2000 have seen temperatures reach or exceed 25.0°C before the end of April. Compared with the average between 1991 and 2020, Northern Ireland saw the greatest difference to normal with temperatures here reaching 0.76°C above.
Sunshine in Spring 2023 was largely just below average. But with 106%, Lancashire was the sunniest county relative to average.
May 2023
Spring 2023 could be regarded as a more or less ‘average’ season, but May has more points of note.
The greatest talking point has been the relative lack of rainfall during the month. Across the UK, only 55% of expected rainfall was recorded (39mm), compared with the long-term average from 1991-2020. This makes May 2023 one of the driest Mays in recent times, although May 2020 was even drier with just 32.8mm.
Some locations recorded even less rainfall with Greater Manchester seeing only 39% of its average for May (26.6mm); making it the driest area of England relative to average. The driest area compared with average for the UK was Inverness which received only a third of expected rainfall. In contrast Cambridgeshire, Dorset and Norfolk all recorded above average rainfall.
Sunshine figures for May 2023 were mixed. Orkney, with just 95 hours saw the least sunshine compared with average for the islands in May since 1969. This was less than half what would be expected in a typical May. The sunniest county relative to average was Cornwall with 137% of average sunshine (289.5 hours).

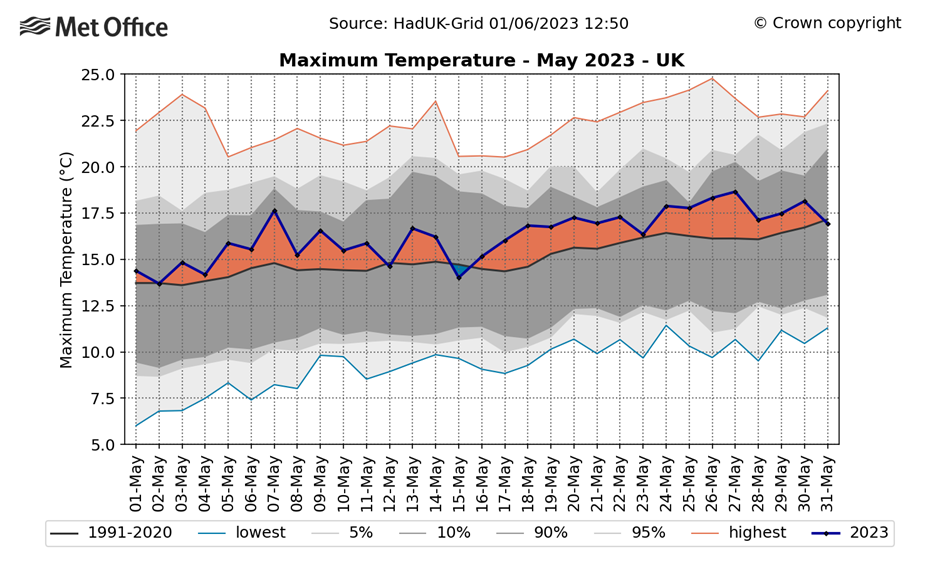
This graph shows the daily maximum temperature averaged across the UK during May. Although much of the month was marginally above average (orange segments) none of these periods of relative warmth contained any significant peaks of heat.
The warmest locations compared to average (for Mean Temperature) were largely spread across Scotland, Northern England and Northern Ireland. Some of these locations saw average temp 1.4°C above the average for 1991-2020.
Mike Kendon of the Met Office’s National Climate Information Centre concluded: “Although mean temperature for May has been above average, it is notable that we haven’t seen any particularly significant peaks of above-average temperature especially during the second half of the month.”


