

Carbon budgets? Emissions scenarios? Degrees of warming? What does it all mean? If you are following the climate change conversation, you will have encountered information on future changes in climate. Carbon budgets, high- and low-emission scenarios, and future warming are all frequently discussed
This can get very confusing, particularly as two or even three of these approaches might be referred to in the same article. There is also significant overlap between these ways of discussing climate change, which can add to the confusion. In this post, we provide an explanation of the differences between these tools and how they are used.
Emissions scenarios
Emissions scenarios are the primary tool climate scientists use to drive climate models and investigate future changes in climate. The scenarios are a series of ‘what-if’ storylines to illustrate the consequences of any mitigation actions that are (or aren’t) taken.
A standard group of scenarios is created to represent a range of different futures, from those which see a lot of climate mitigation (resulting in lower carbon emissions) through to those which see minimal mitigation (higher carbon emissions). These scenarios are then used by climate modelling centres around the world, and the resulting climate simulations underpin much of the Intergovernmental Panel on Climate Change (IPCC) Physical Climate Change report. The scenarios enable decision making around adapting to (and avoiding) the worst effects of climate change.
The most recent set of scenarios are called the Shared-Socioeconomic Pathways (SSPs); whilst a previous version was called the Representative Concentration Pathways (RCPs). The SSPs combined the potential emissions changes with a range of socio-economic factors to develop their five different storylines. SSP 1-1.9 represents a low-emissions scenario, whilst SSP 5-8.5 represents the highest level of emissions and minimal mitigation. Irrespective of the emission scenarios used, the output provides day-by-day projections for the future.
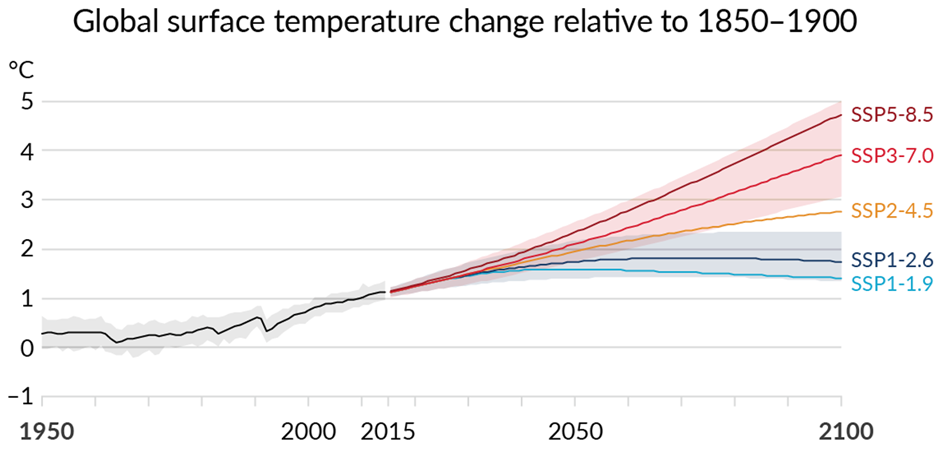
Figure 1. Global surface temperature change 1950-2100 as a difference to the 1850-1900 period. This figure is a reproduction of Figure SPM.8 from the IPCC 6th Assessment Report WGI Summary for Policy Makers.
Figure 1 shows the mean future warming from five of the SSPs, with shading which demonstrates the range of uncertainty for the SSP1-2.6 and SSP3-7.0 scenarios. All five simulations use the same historical period through to 2015 and then project forward from then. The figure allows you to see how the scenarios diverge as the different levels of emissions they represent affect future warming.
Global warming levels
In 2015, COP21 resulted in the Paris Agreement, which committed to restrict warming ‘well below 2 °C’ (compared to the 1850-1900 baseline) and that countries would pursue efforts to limit the increase to 1.5 °C above pre-industrial levels. Since then, there has been an increased use of global warming levels (GWLs) in the communication of climate change.
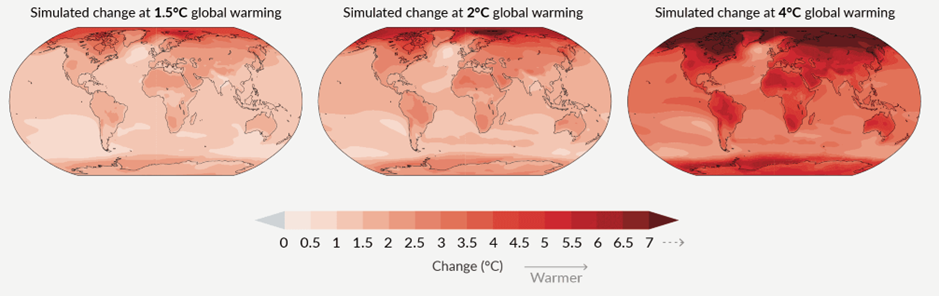
Figure 2. Global mean surface temperature change for warming of 1.5 °C, 2 °C and 4 °C above the 1850-1900 baseline period. Figure modified from Figure SPM.5A from the IPCC 6th Assessment Report WGI Summary for Policy Makers.
The GWLs come without a timeframe and represent a world that has reached the stated average warming for the period. It allows the user to investigate a world that has reached a certain level of global mean temperature regardless of the time at which that level has been reached, albeit acknowledging that many impacts – such as sea level rise – will not stabilise at a given temperature. GWLs have been used in a range of circumstances, including the UK’s Climate Change Risk Assessment where they underpinned the assessment of future climate risk.
They are also used to investigate extreme events and impacts related to human health. Figure 2 here compares the differences in surface temperature at 1.5 °C, 2°C and 4°C, to highlight differences in warming response between those three different GWLs.
Carbon budgets
A carbon budget (as defined in the IPCC AR6 Glossary) looks at ‘the maximum amount of cumulative net global anthropogenic carbon dioxide (CO₂) emissions that would result in limiting global warming to a given level’. Whether considering observed changes in recent climate or looking at future changes using global warming levels or emissions scenarios, there is a carbon budget associated with them.
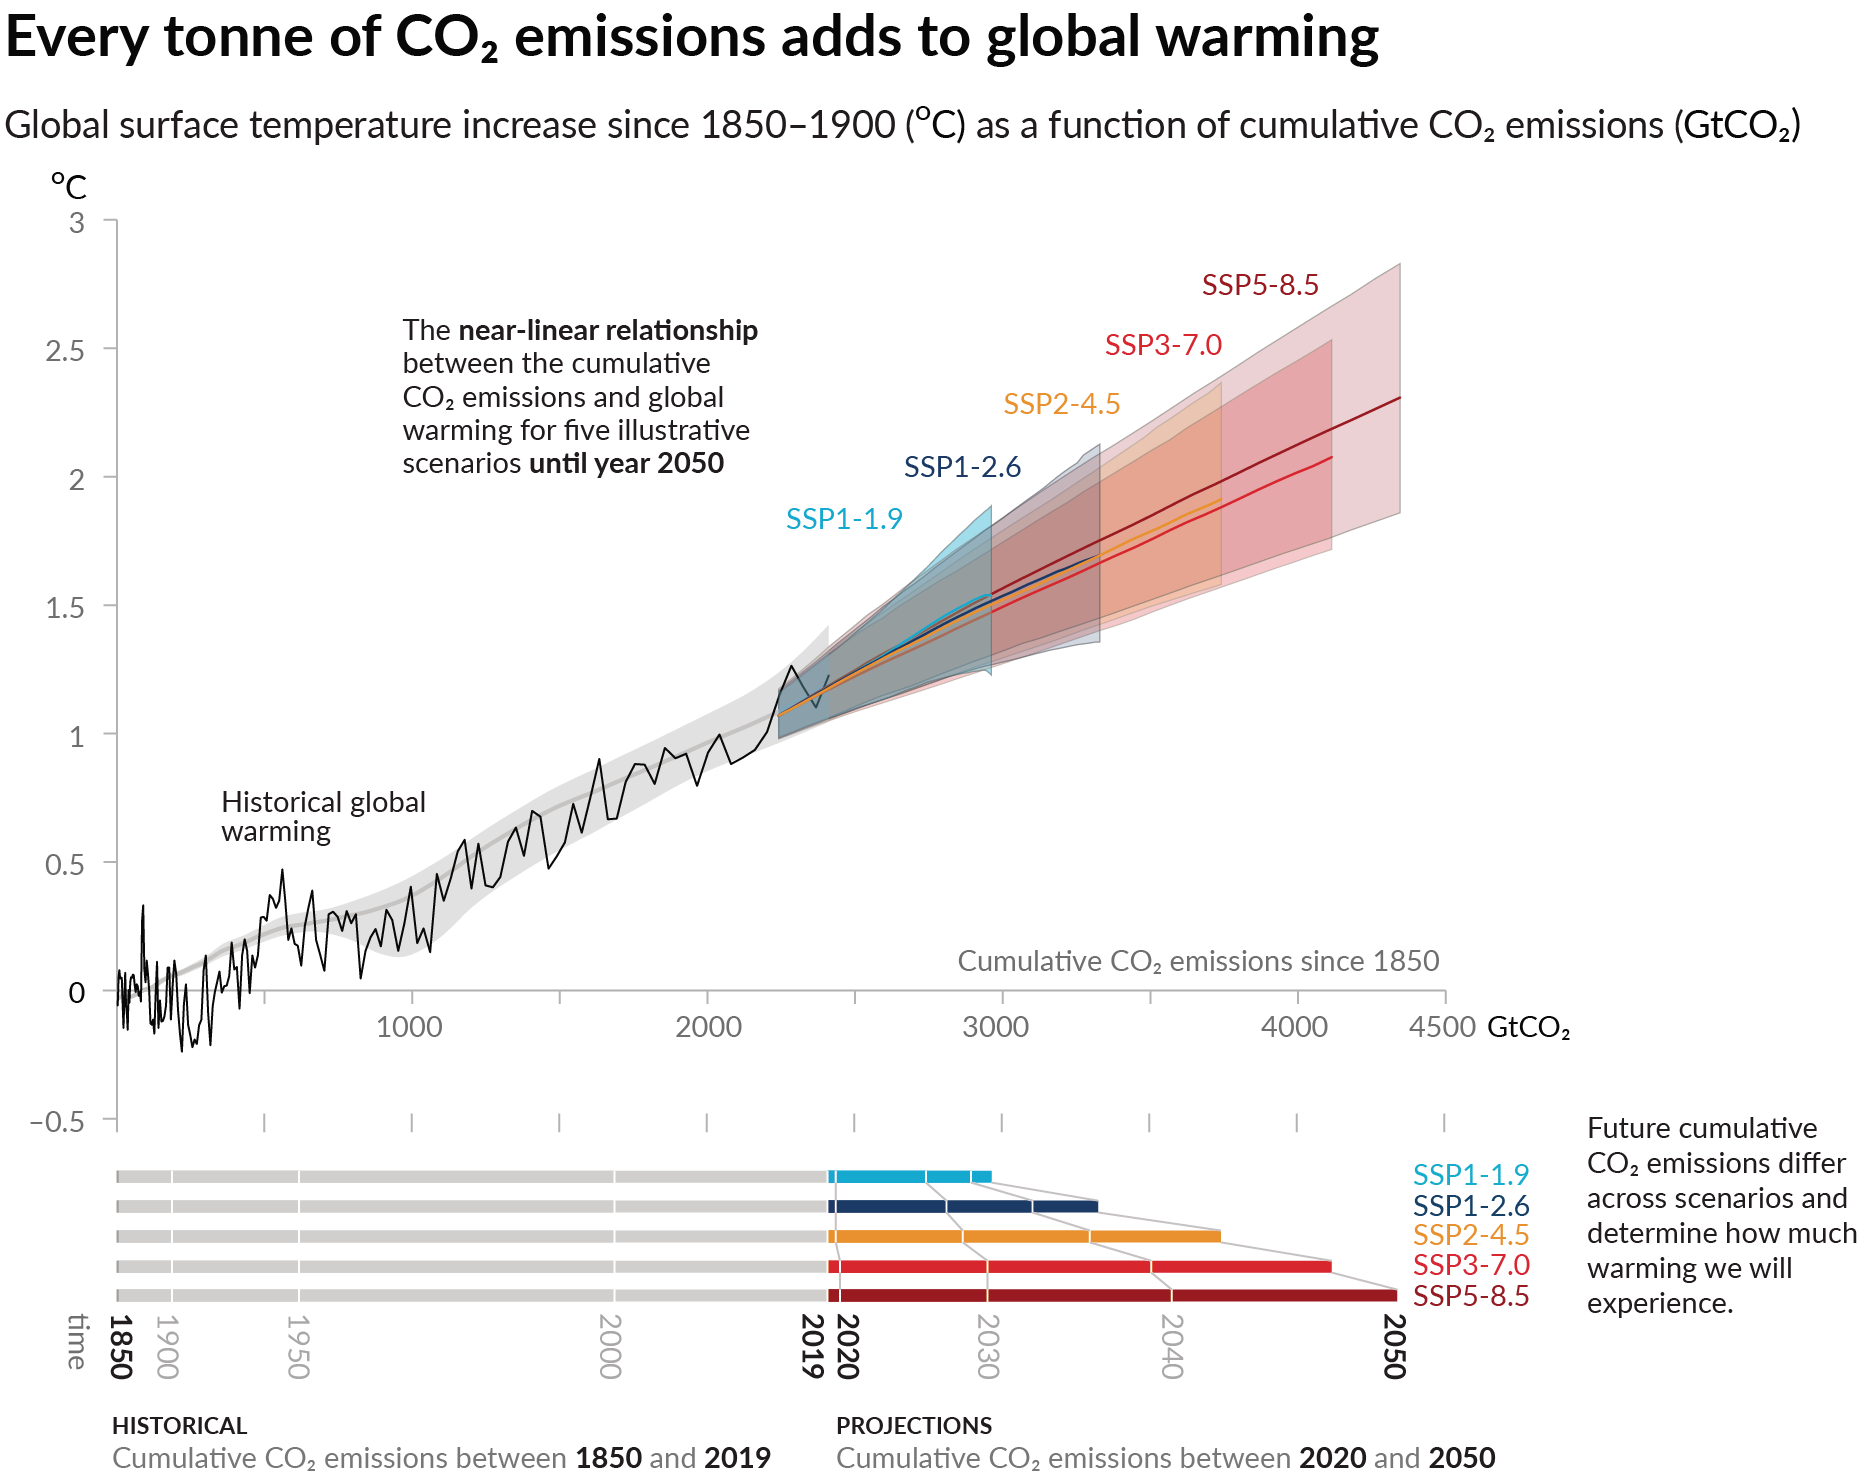
Figure 3. Cumulative emissions between 1850-2019 (grey) and the remaining carbon budget for five of the SSP scenarios (colour) out to 2050. Figure modified from Figure SPM.10 from the IPCC 6th Assessment Report WGI Summary for Policy Makers.
Figure 3 represents the carbon emissions that have occurred (the grey bars) and then the future budget that remains for five SSP scenarios used in Figure 1. This provides a ‘budget’ for the total cumulative emissions that could be emitted within the respective scenarios. It is also possible to represent these budgets through time with respect to the amount of carbon being emitted each year until the point emissions reach net zero.
How these link together…
The future carbon emissions detailed in the carbon budgets underpin the creation of the original, different emissions scenarios. The emissions scenarios then drive the climate models from which the global warming levels can be calculated. The level of warming simulated by each emission scenario then enables informed discussion about the mitigation required to reduce potential impacts which feeds back into discussions around carbon budgets. This can then evolve to determine how much of the budget remains to keep within a certain level of warming.
…and how they are used
Carbon budgets are calculated based on our knowledge of the earth system – how the climate responds to the amount of CO₂ and how natural ecosystems emit and absorb CO₂ from the air. The budget depends on land use changes and also the make-up of fossil fuel sources of energy (coal vs gas vs oil) and the use of alternative fuel sources. Knowing how much CO₂ we can emit to stay under certain temperature thresholds helps governments negotiate how this could be achieved. The UK publishes five-year carbon budgets, with the sixth budget covering the period 2033 to 2037 published in December 2020.
Climate model simulations based on emissions scenarios have been at the centre of climate science for over 30 years and are involved in a range of climate impact studies. The scope of this work is very broad, but examples of Met Office work using climate model simulations include creating bespoke storylines for future climate, researching sea level rise and future coastal flood risks, and exploring the impact of future climate on agriculture.
As well as informing research projects, outputs from emissions scenario-based model simulations have also underpinned communications such as the Future Forecast and a collaboration with BBC Sport looking at the 2050s.
Global warming levels allow for the analysis of climate responses at various temperature levels including the risks and potential impacts associated with those specific levels. For example, research into future changes to high impact weather in the UK looked at changes to temperatures and droughts at warming levels from 1.5 °C to 4 °C. By comparing the different metrics at each warming level, it is possible to assess the vulnerability to changes in future a climate regardless of timeframe, and to understand how the warming causes different impacts in the future.
Mitigation and adaptation
These three different ways to measure and predict our future climate are ultimately three different sides of the same (very odd-shaped) coin. All three methods allow us to consider the future and how we respond. It is important to understand the impacts and risks in different emissions scenarios and at different warming levels.
Mitigating against a changing climate by reducing greenhouse gas emissions is critical to limiting warming which would help us avoid the worst impacts of climate change. We also need to adapt to the climate changes we are already seeing and the changes that are expected in the coming decades to make sure we avoid the worst impacts.
Action is required across all levels of society – to find out more about how you can make a difference, take a look at our Get Climate Ready webpages.