

Warm May and spring for the UK
Author: Press Office
13:47 (UTC+1) on Mon 3 Jun 2024
The UK had its warmest May and meteorological spring on record according to provisional Met Office figures in what was also a wet and dull season for many.
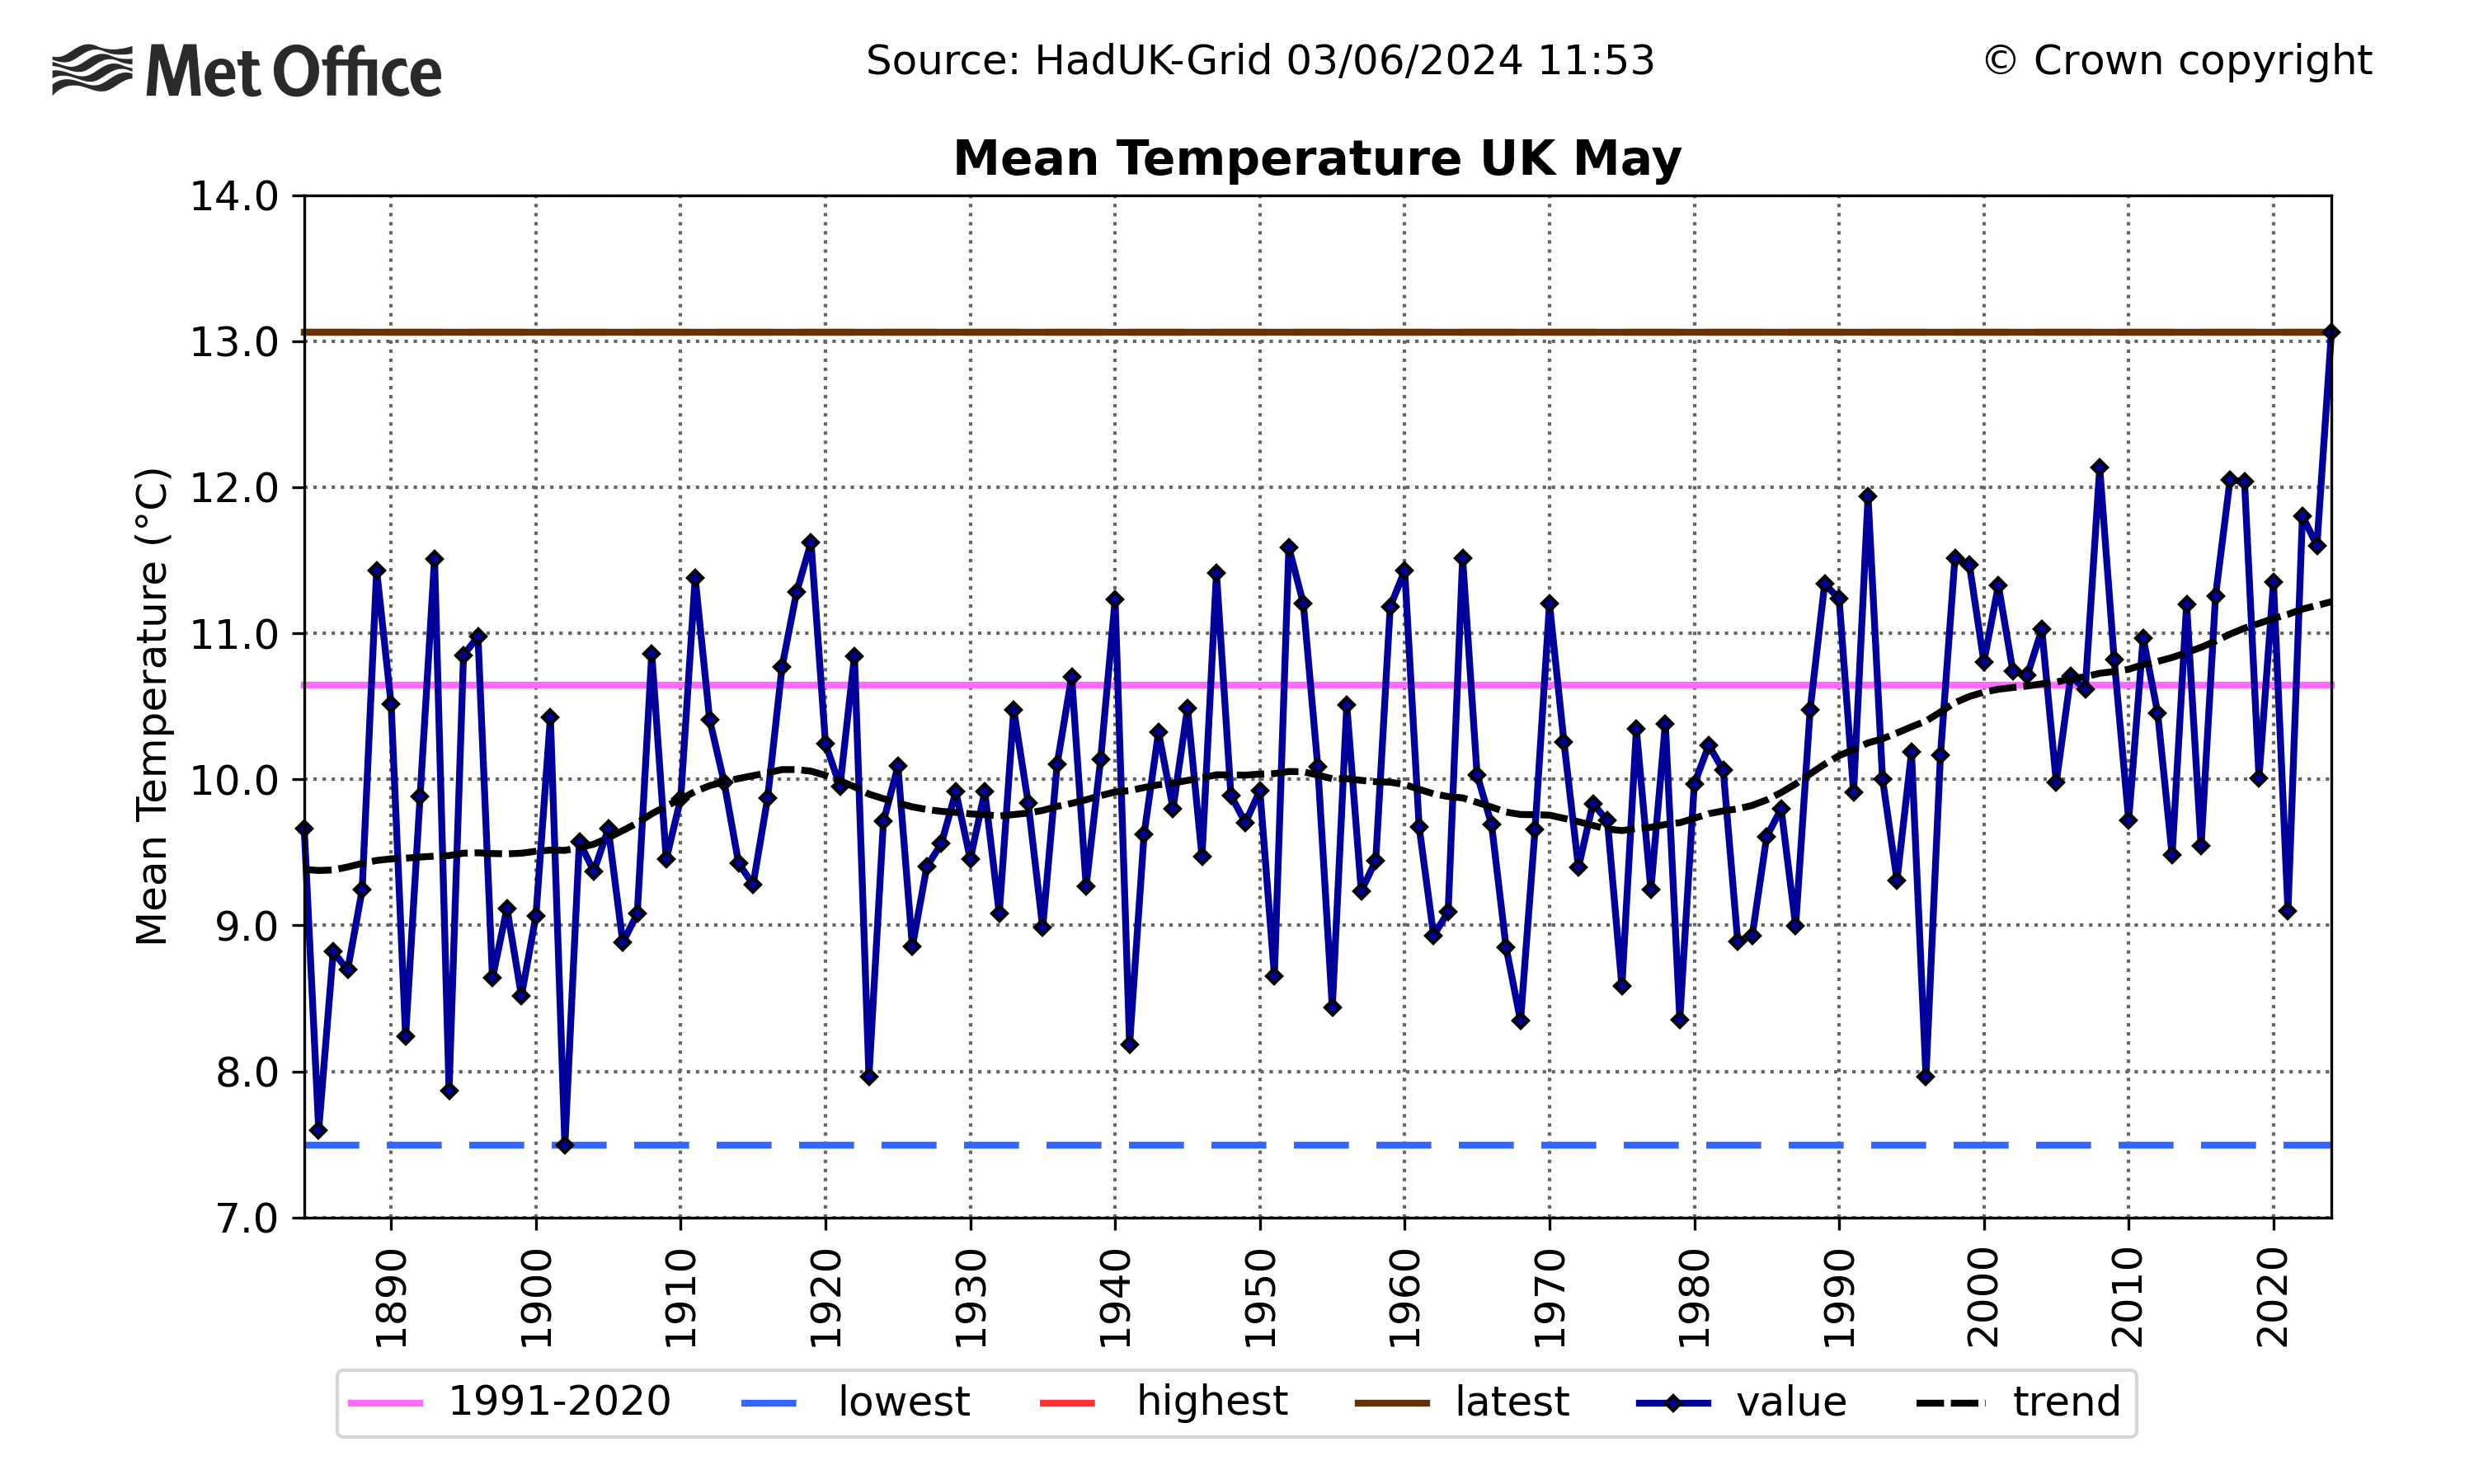
May 2024’s average mean temperature of 13.1°C for the UK beat 2008’s previous record figure of 12.1°C in a series which dates back to 1884.
The month’s mean temperature has been influenced particularly by above average temperatures in the northern half of the UK, with Scotland’s May mean temperature of 12.3°C beating 2018’s previous record by 1.6°C. England and Northern Ireland also set a mean temperature record for the month of May, while Wales equalled its figure from 2008.
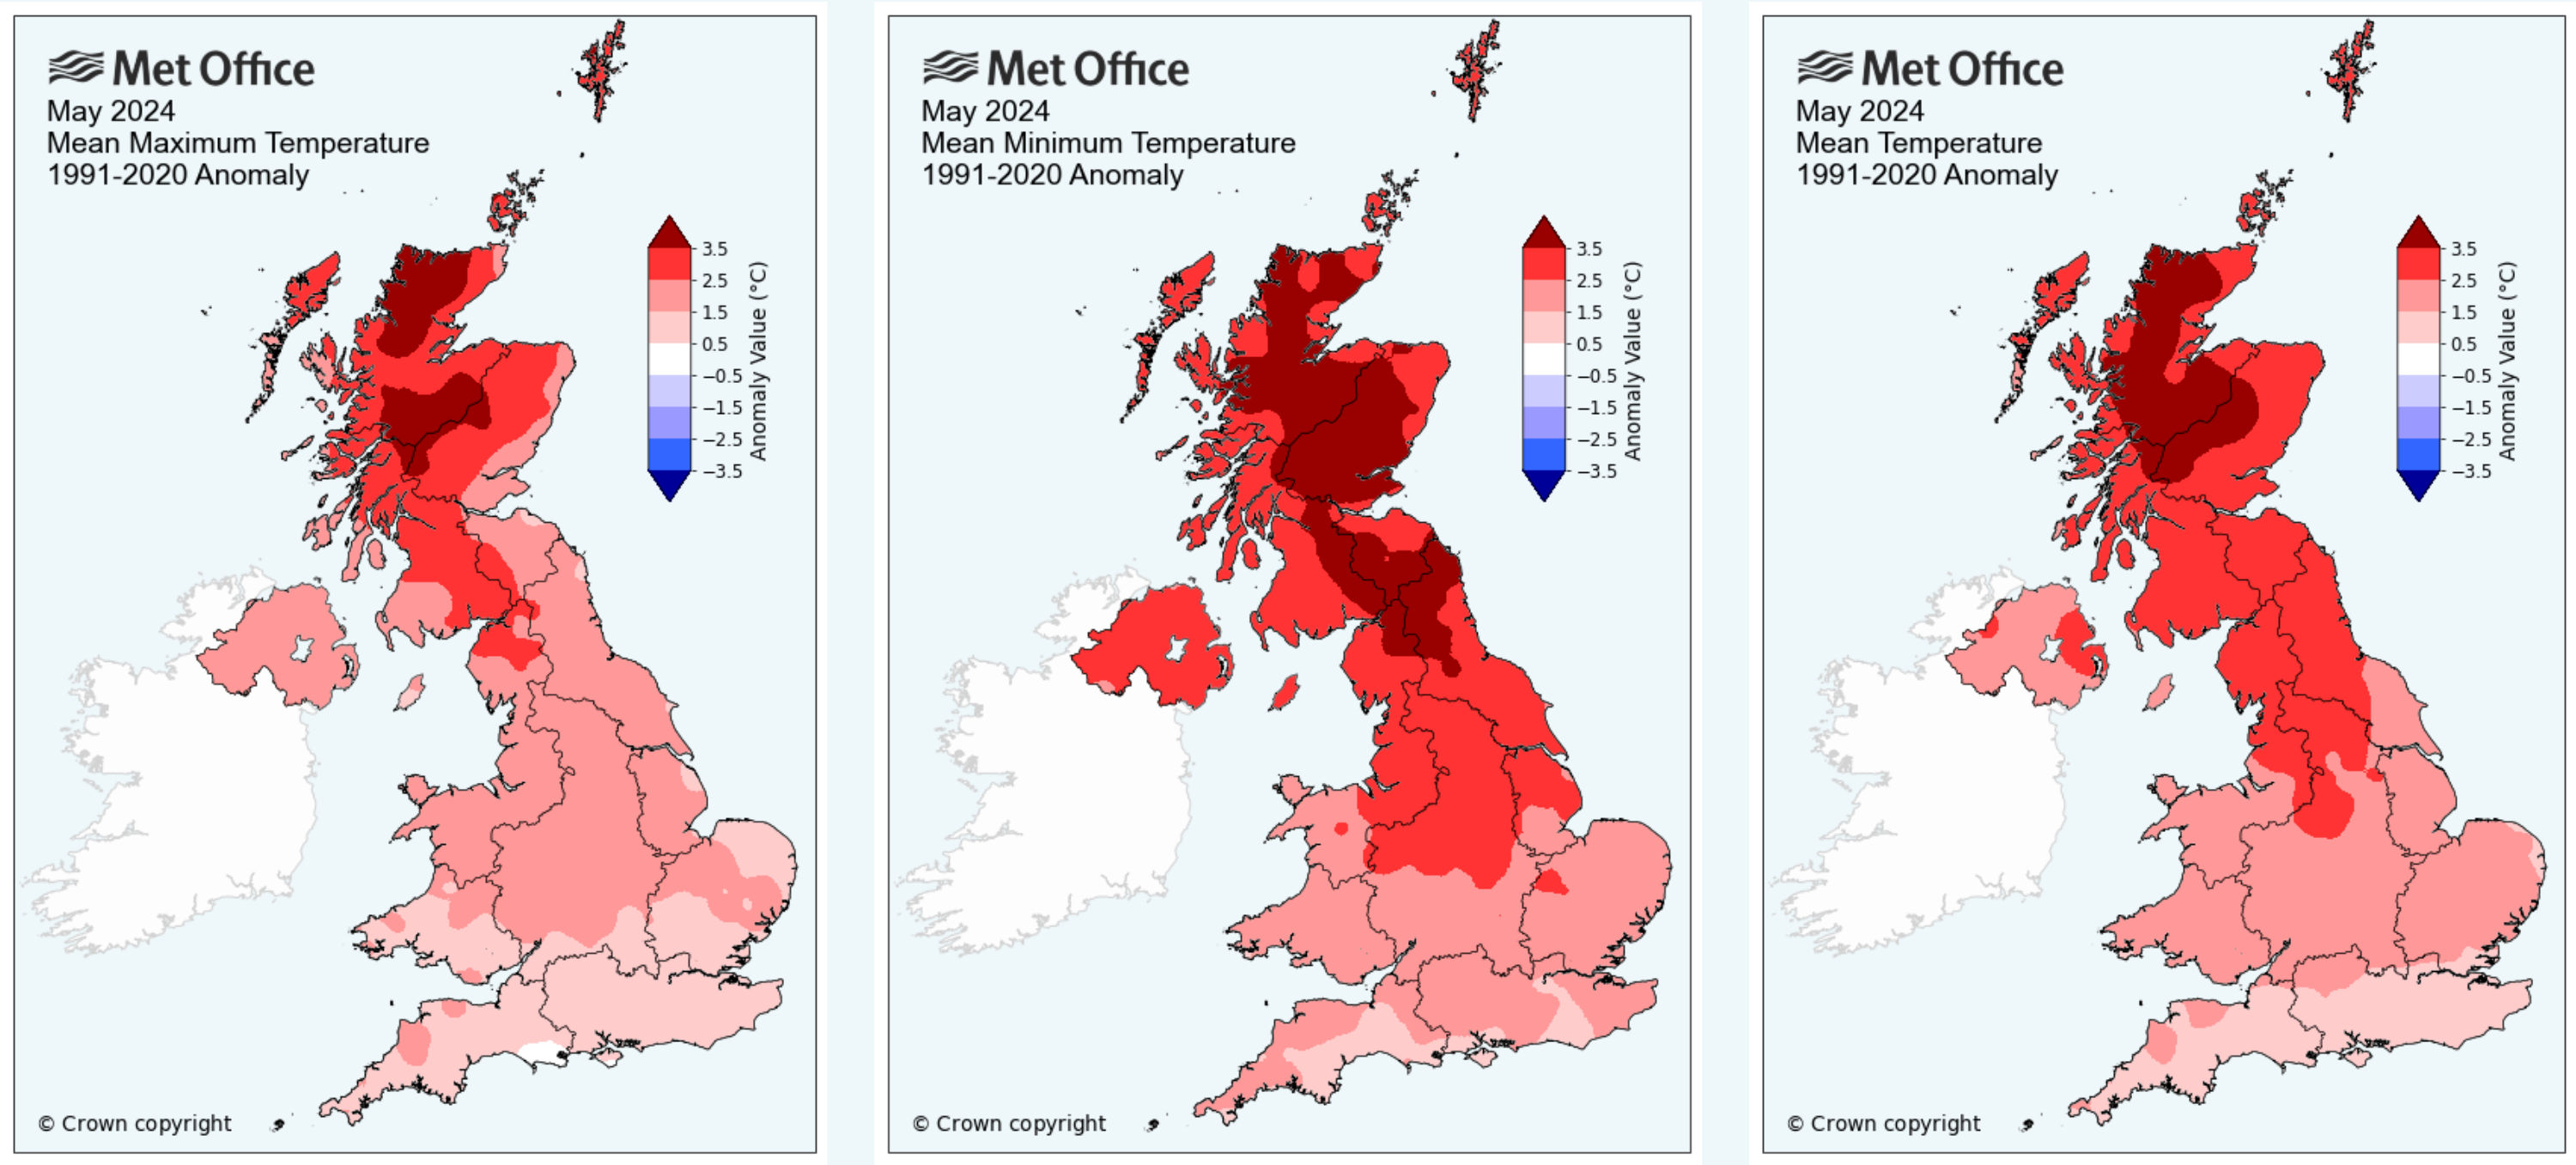
A Met Office Spokesperson said: “While it may not have felt like it for many, with sunshine in relatively short supply, provisional figures show May was the warmest on record in our series back to 1884. This warmth was especially influenced by high overnight temperatures, with the average UK minimum temperature for May 1.2°C higher than the previous record.
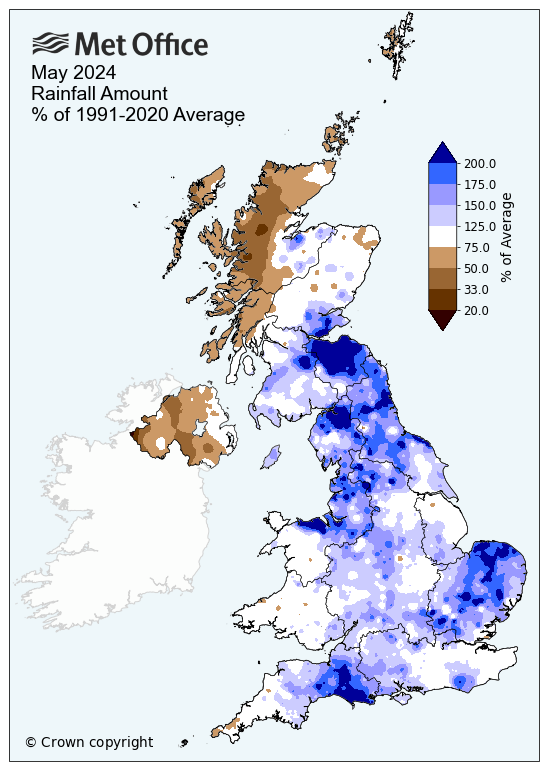
“Rainfall was above average for the UK, while some areas in the south saw over a third more rain than average. In contrast, Northern Ireland and Scotland were slightly drier than average in the month.”
The graph below shows every May’s average UK mean temperature back to 1884.
Mixed rainfall for May across the UK
Rainfall in May had much regional variation, with England and Wales generally wetter than average, while those in Northern Ireland and Scotland saw less in the way of rain. For the UK, this meant a slightly above average month of rainfall, with 82.5mm of rain, which is 16% more than average.
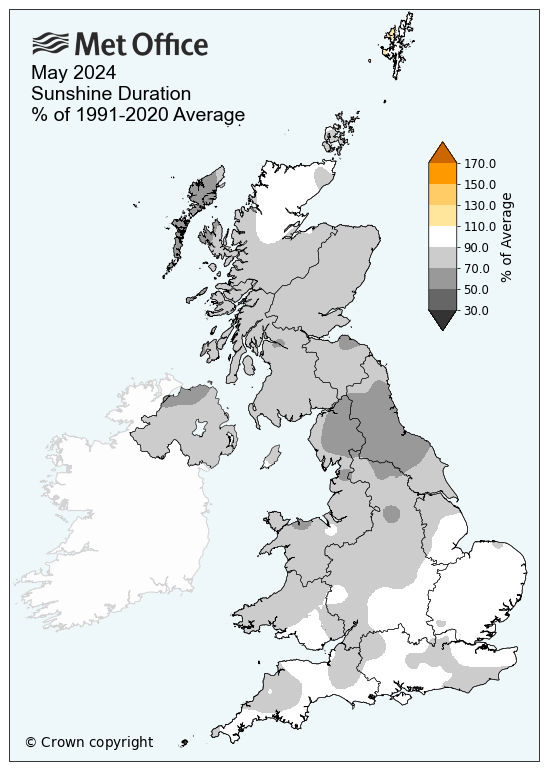
Dull month for many
Sunshine amounts were below average for the UK in May. The UK saw 159.3 hours of sunshine, which was 17% fewer than average, with England, Wales, Scotland and Northern Ireland all having below average sunshine hours.
The UK's climate continues to change. Recent decades have been warmer, wetter and sunnier than the 20th century. Natural variation will continue to play a role in the UK’s weather.
Find out more about the effects of climate change on UK weather events.
|
Provisional May 2024 stats |
Max temp (°C) |
Min temp (°C) |
Mean temp (°C) |
Rainfall (mm/%) |
Sunshine (hours/ %) |
|||||
|
Actual |
91/20 anom |
Actual |
91/20 anom |
Actual |
91/20 anom |
Actual |
91/20 anom |
Actual |
91/20 anom |
|
|
UK |
17.2 | 2.1 | 9.0 | 2.7 | 13.1 | 2.4 | 82.5 | 116 | 159.3 | 83 |
|
England |
17.8 | 1.6 | 9.3 | 2.4 | 13.6 | 2.0 | 83.9 | 147 | 169.5 | 85 |
|
Wales |
16.8 | 1.6 | 8.7 | 2.1 | 12.7 | 1.8 | 95.4 | 110 | 157.3 | 82 |
|
Scotland |
16.3 | 2.9 | 8.5 | 3.5 | 12.3 | 3.2 | 82.8 | 93 | 145.8 | 80 |
|
Northern Ireland |
16.7 | 1.8 | 9.1 | 2.9 | 12.9 | 2.4 | 46.9 | 63 | 140.3 | 77 |
Spring 2024 provisional statistics
Meteorological spring (March, April and May) was the warmest on record by mean temperature, in figures that were influenced by high overnight temperatures.
March started the season with a mild and wet month, and that theme continued through much of spring. April was a wet month, with temperatures overall slightly above average.
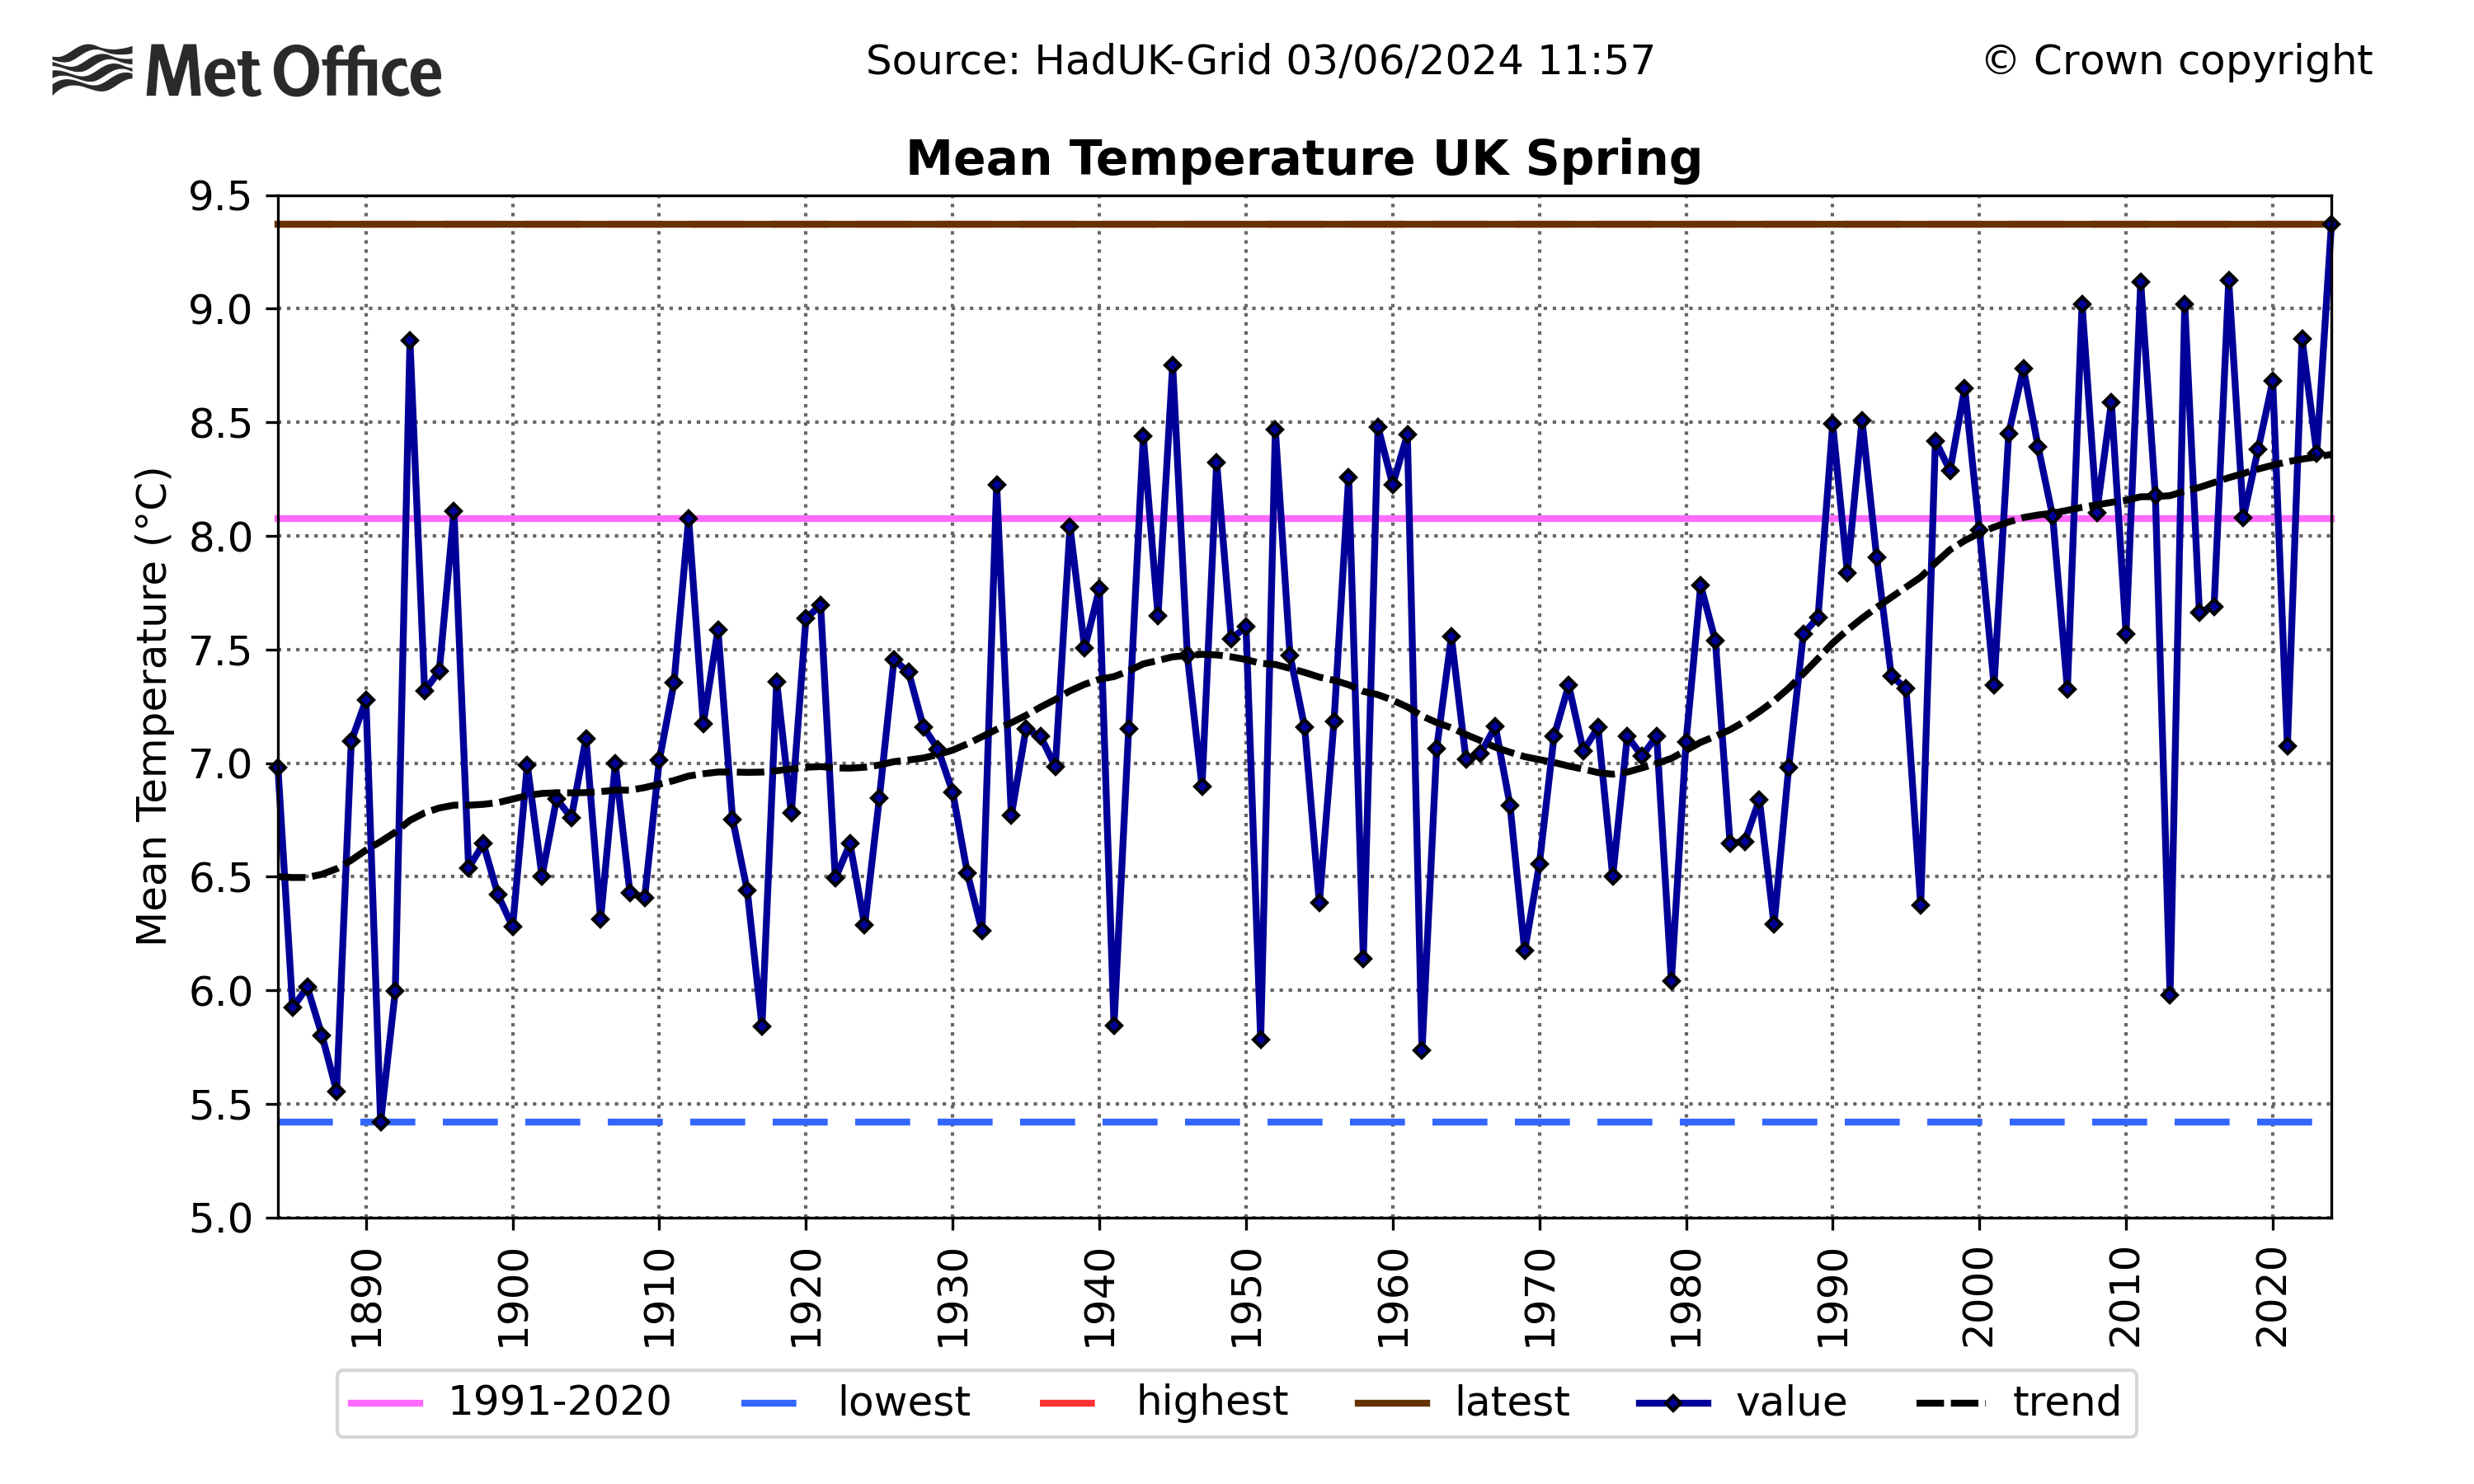
Spring 2024’s average mean temperature for the UK has a provisional figure of 9.37°C, topping the figure of 9.12°C set in 2017.
England and Scotland also provisionally had their respective warmest springs on record by mean temperature. England’s mean temperature of 10.21°C topped 2017’s figure of 10.01°C, while Scotland’s figure of 7.97°C passed its previous record figure of 7.69°C set in 2014.
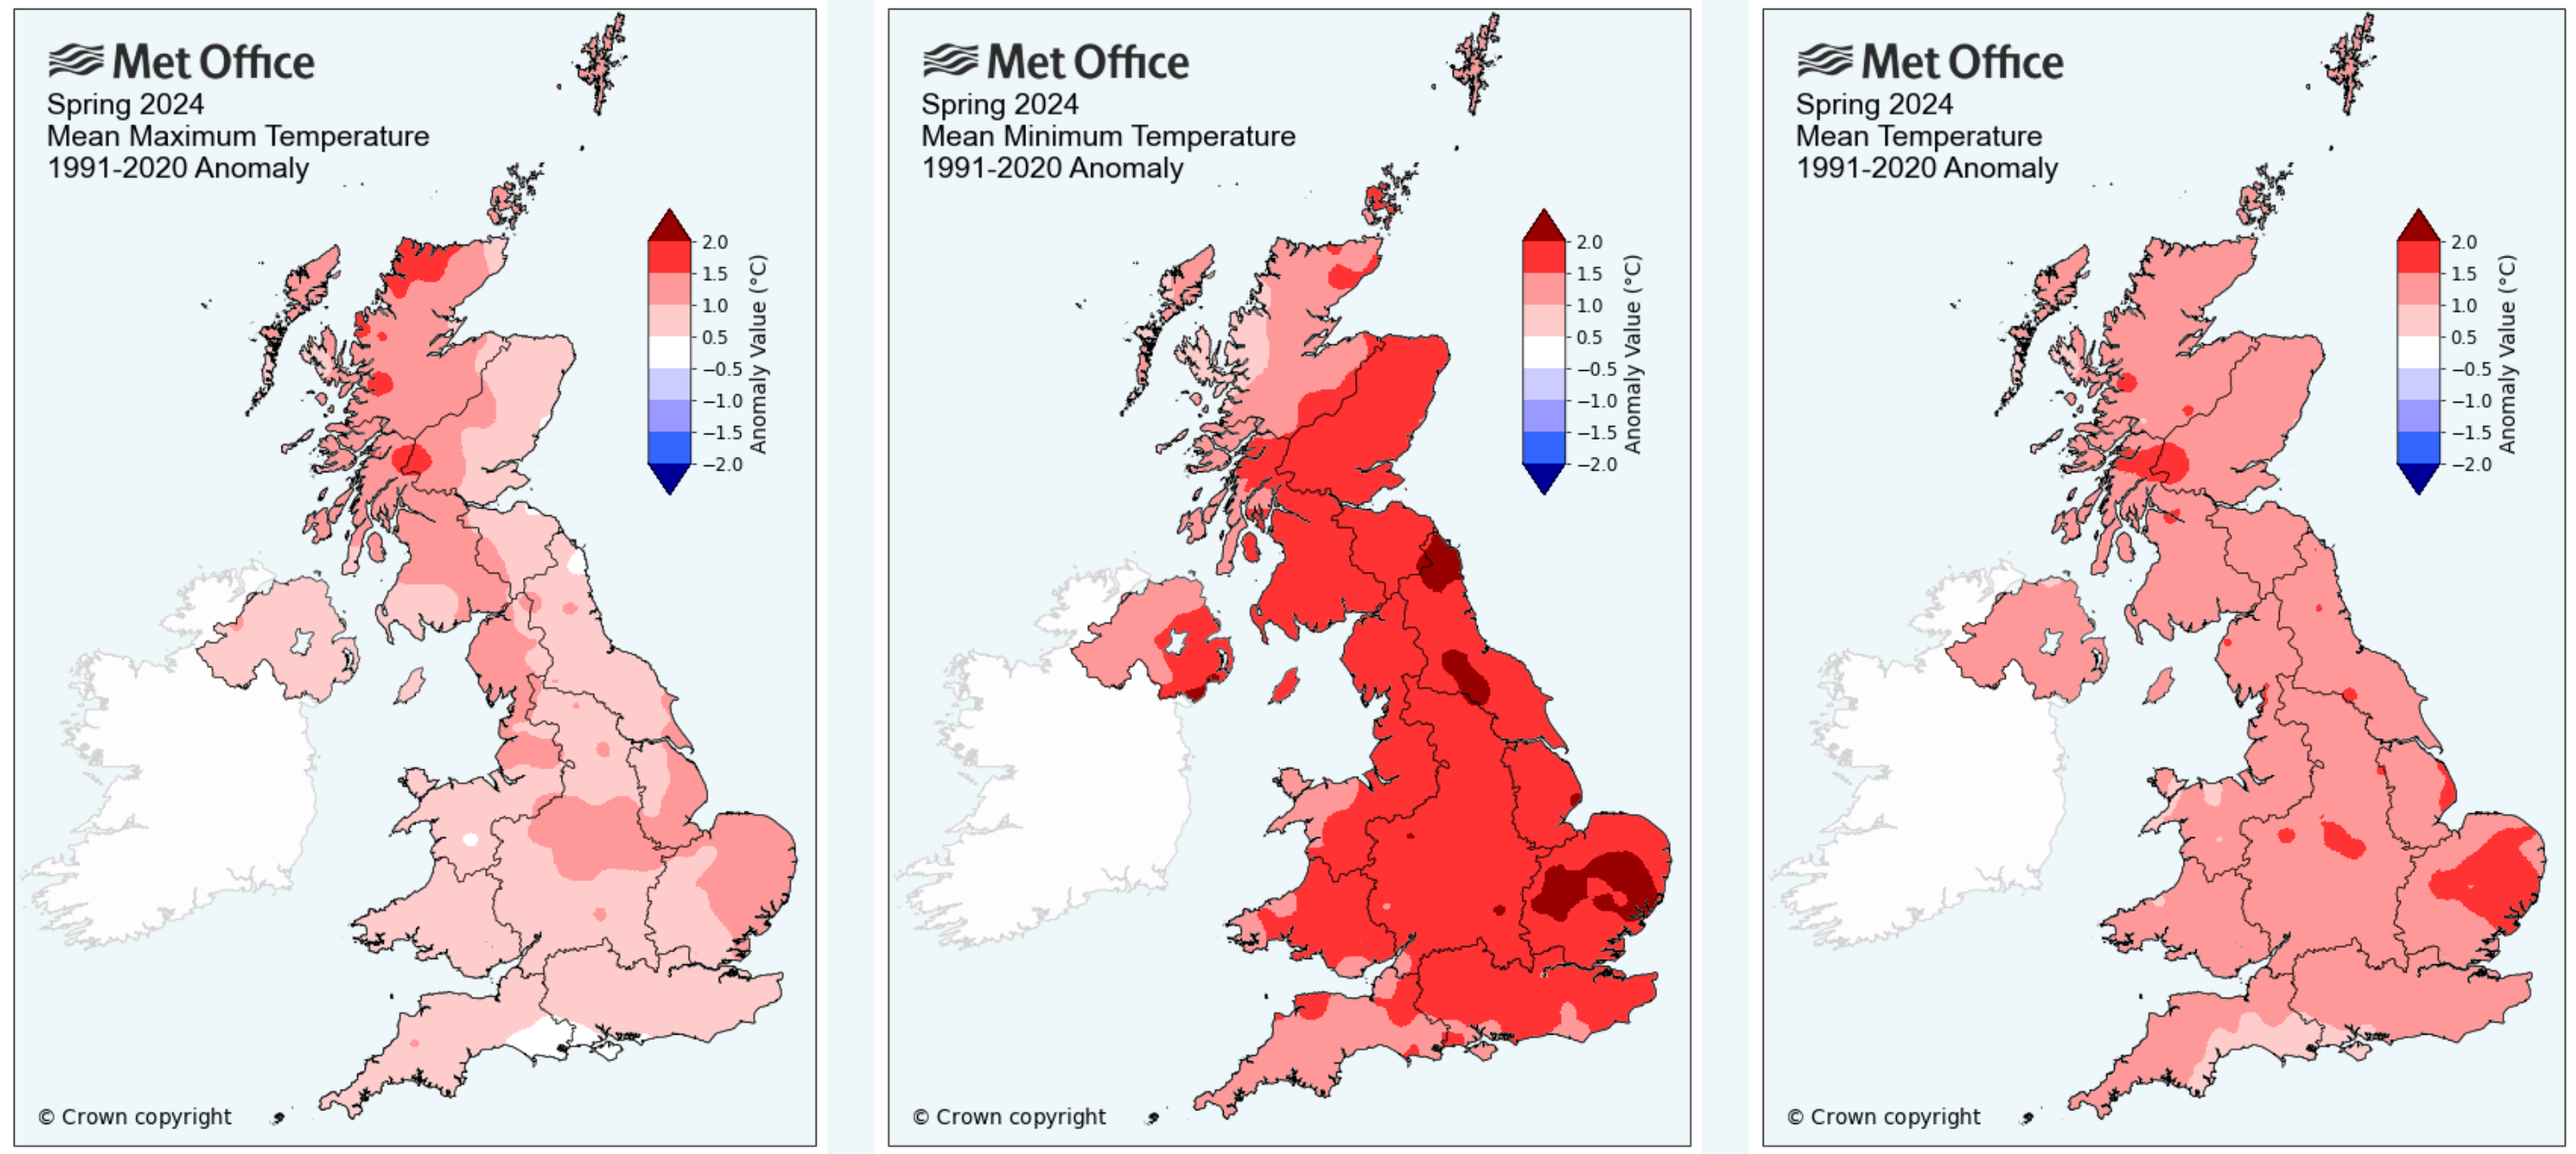
A Met Office Spokesperson said: “Higher than average temperatures in March and May, either side of a slightly warmer than average April, means that Spring 2024 is the warmest on record according to mean temperature. Despite the warmth, sunshine hours during the season were well below average, though not troubling any national records.
“High overnight temperatures through the season have helped to push the mean temperature figure for the season beyond the previous record, while it has also been a wet spring for many.”
The graph below shows spring's average mean temperature for the UK since 1884.
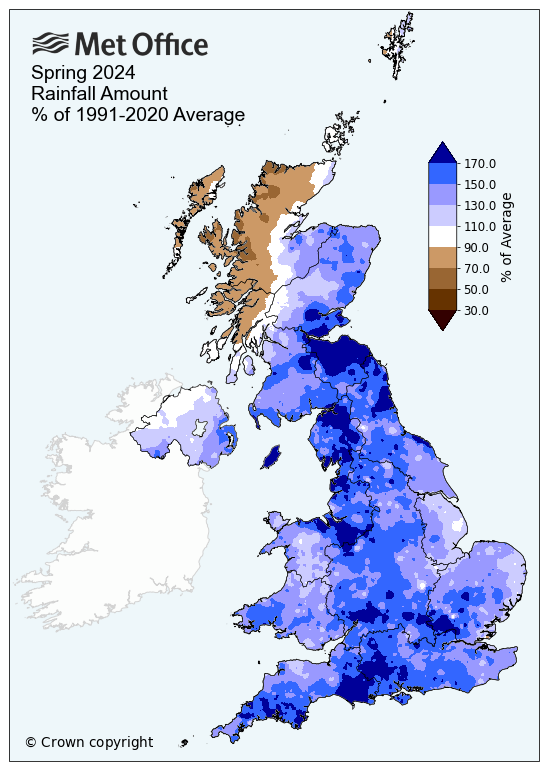
Wet weather in spring
The UK had its sixth wettest spring on record and its wettest since 1986 in a series which goes back to 1836.
The UK saw 301.7mm of rain over spring, 32% more than average. England and Wales had their respective fifth and eighth wettest springs on record.
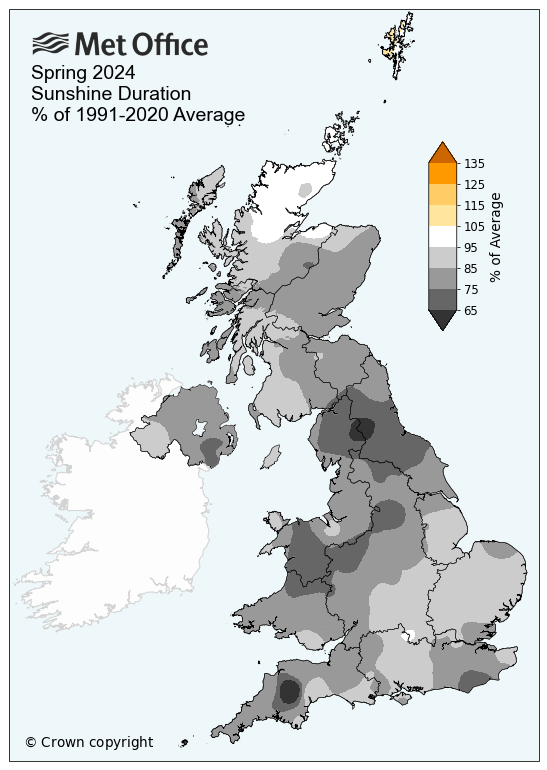
Below average sunshine
Sunshine hours were below average for each of the three months of spring, resulting in a dull period for many, though not record-breaking.
The UK had 377.4 hours of sunshine, 17% fewer than average.
|
Provisional Spring 2024 stats |
Max temp (°C) |
Min temp (°C) |
Mean temp (°C) |
Rainfall (mm/%) |
Sunshine (hours/ %) |
|||||
|
Actual |
91/20 anom |
Actual |
91/20 anom |
Actual |
91/20 anom |
Actual |
91/20 anom |
Actual |
91/20 anom |
|
|
UK |
13.07 | 0.94 | 5.71 | 1.64 | 9.37 | 1.30 | 301.7 | 132 | 377.4 | 83 |
|
England |
14.02 | 0.89 | 6.40 | 1.76 | 10.21 | 1.34 | 263.7 | 154 | 390.0 | 81 |
|
Wales |
12.92 | 0.68 | 6.00 | 1.55 | 9.43 | 1.12 | 389.4 | 140 | 357.5 | 78 |
|
Scotland |
11.56 | 1.12 | 4.46 | 1.47 | 7.97 | 1.31 | 344.4 | 112 | 366.4 | 87 |
|
Northern Ireland |
12.85 | 0.75 | 5.70 | 1.50 | 9.28 | 1.14 | 280.7 | 119 | 347.6 | 80 |