Record-breaking rainfall for some this September
Author: Press Office
16:28 (UTC+1) on Tue 1 Oct 2024
It has been the wettest September on record for some counties, according to provisional Met Office figures, though no national monthly records have been broken.
England, and more specifically southern England, has been particularly wet compared to average.
Ten English counties experienced their wettest September on record and for Bedfordshire and Oxfordshire, September 2024 was the wettest calendar month the counties have experienced, in a series dating back to 1836.
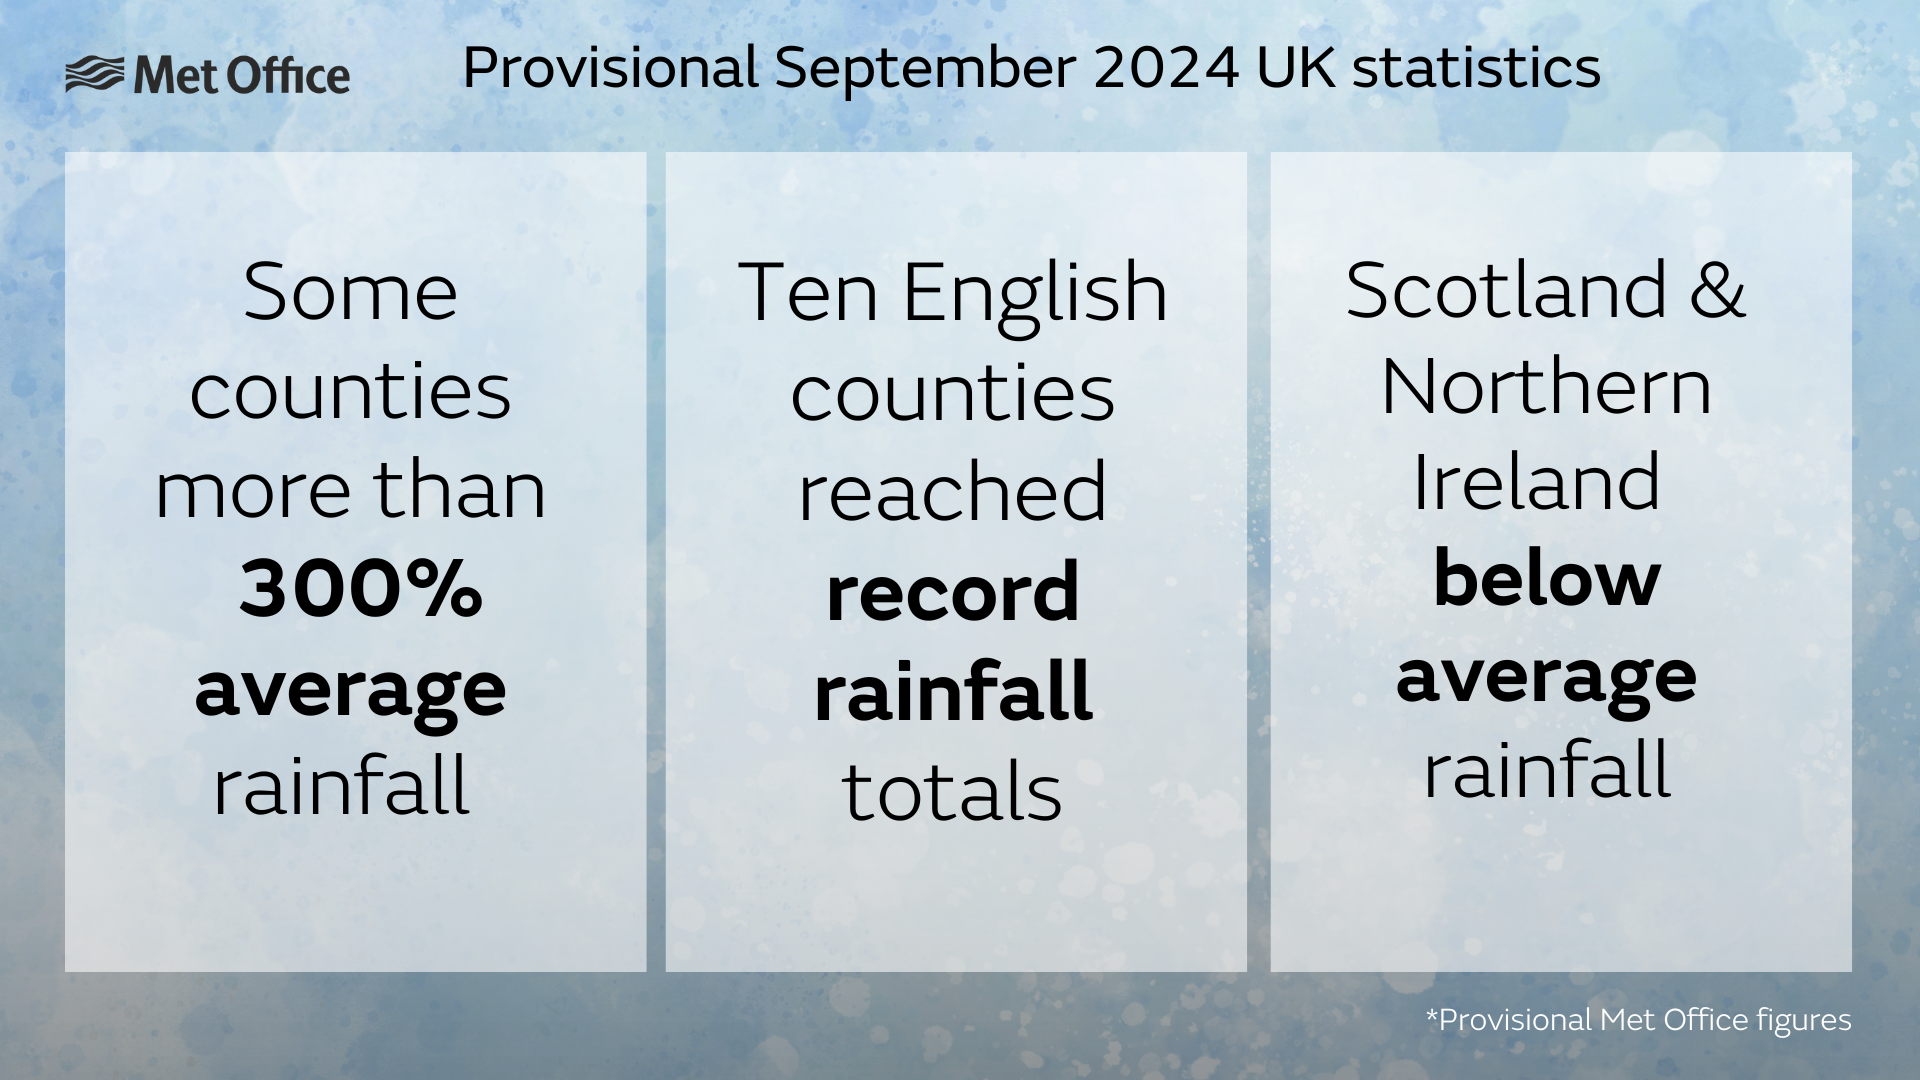
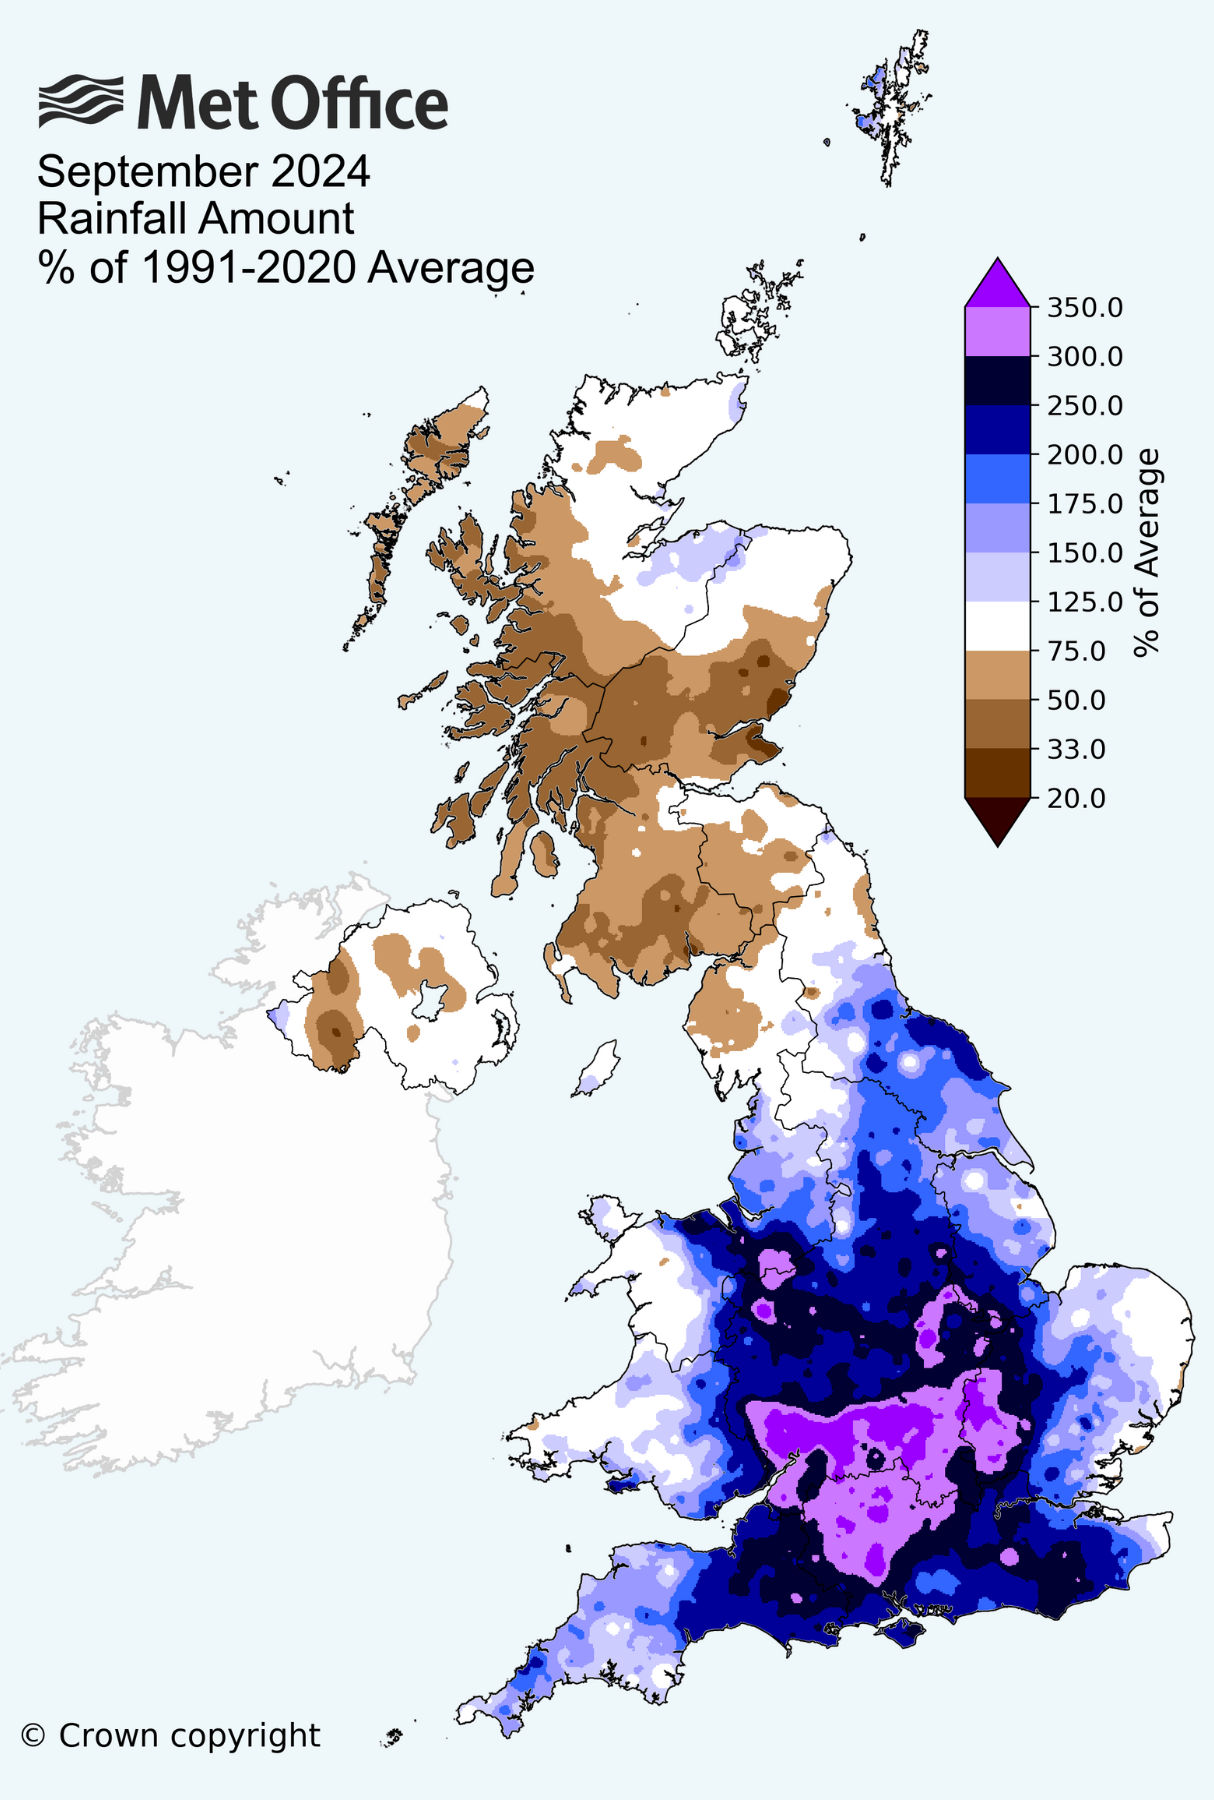
But, although September has been exceptionally wet for southern and central areas, Scotland and Northern Ireland have been drier than average, balancing out the rainfall for the UK as a whole to 25% above the long-term meteorological average.
Temperatures and sunshine hours have been closer to average, though again with some regional differences.
Met Office Scientist Emily Carlisle said: “September saw unsettled weather across the UK. The jet stream was south shifted for most of the month, making it very wet for some in the south, but rather dry for some in the north.
“The month began with heavy showers and thunderstorms to the south of the UK, whilst the north of the country saw much drier and warmer conditions.
“Although mid-month saw a return to more settled weather and an increase in temperatures, low pressure was never too far away and the end of the month concluded with frontal systems bringing heavy rain and thunderstorms, with an Amber National Severe Weather Warning being issued.”
How wet has September been?
Rainfall in September has seen much regional variation. England saw 95% more rainfall than its September average, with Wales experiencing 39% more.
Scotland and Northern Ireland however, saw far less in the way of rain – 37% and 18% below average.
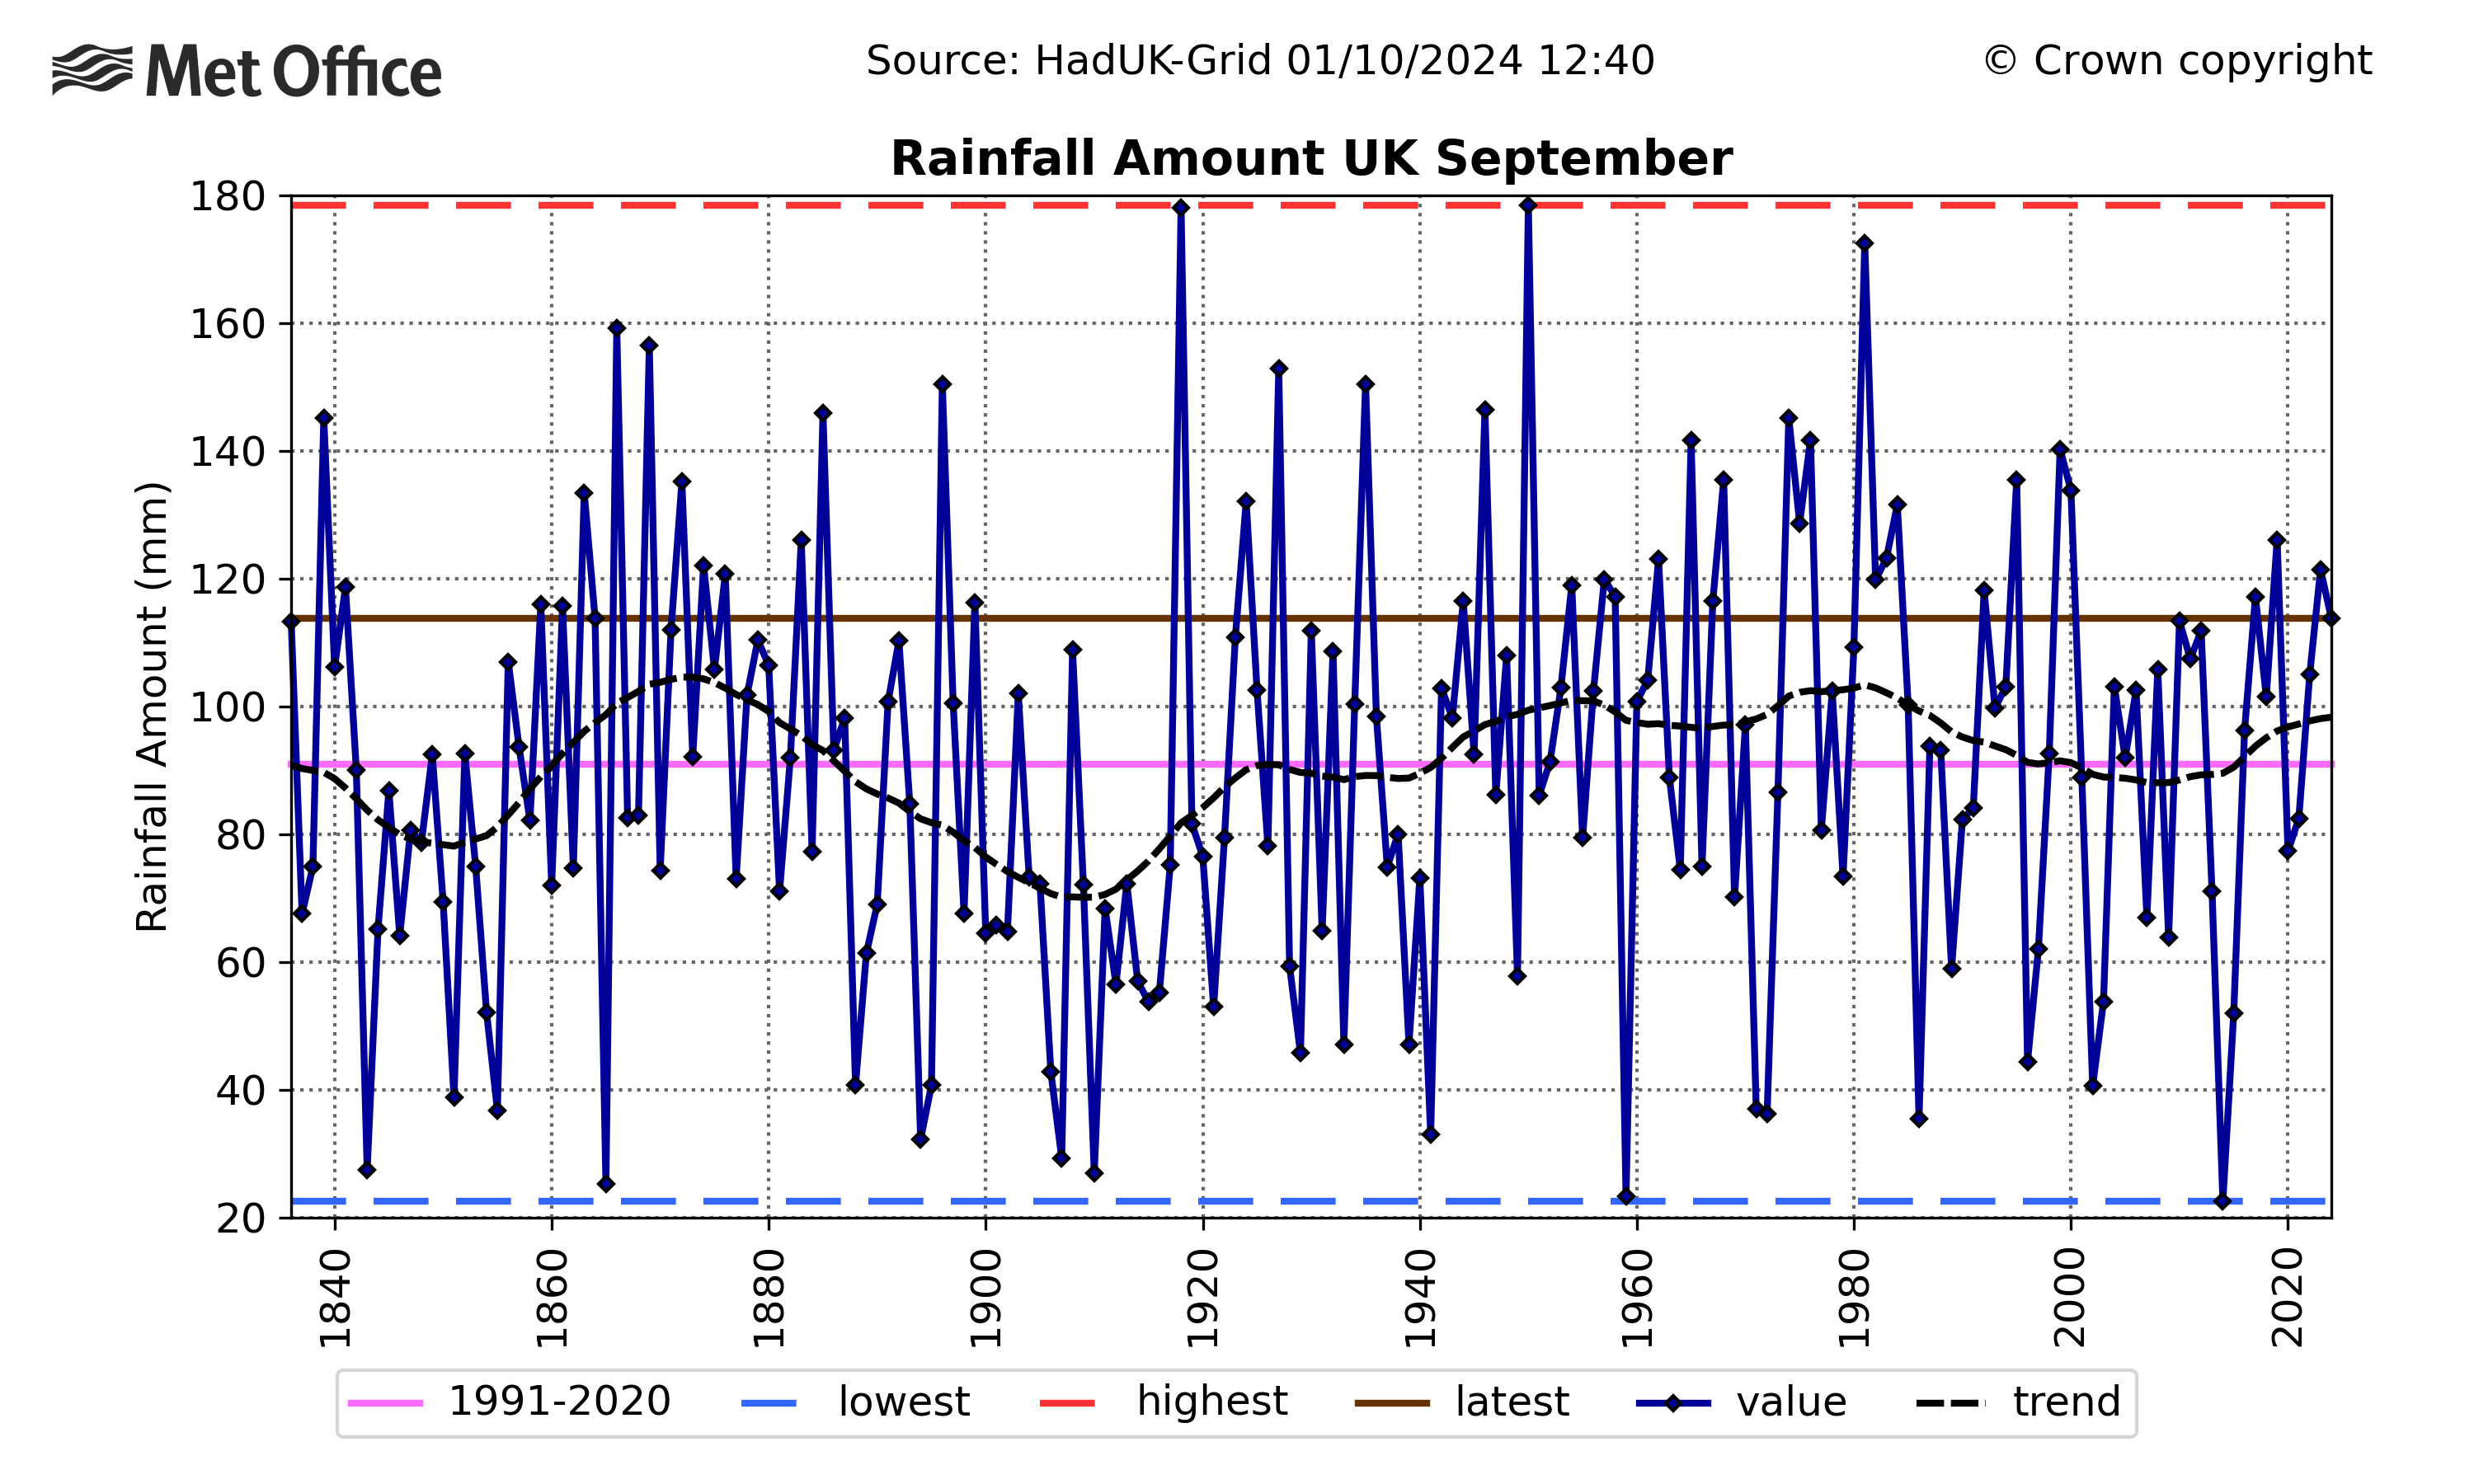
For the UK, this meant 114.1mm of rainfall was recorded across the month, 25% more than average. This total is still well behind the UK’s highest September rainfall total of 178.5mm recorded in 1950.
September has been a very wet month for southern and central England in particular, with some counties seeing more than three times (300%) their average September rainfall.
Seven English counties, Bedfordshire (182.7mm), Berkshire (172.1mm), Buckinghamshire (176mm), Gloucestershire (212.2mm), Northamptonshire (171.3mm), Oxfordshire (185.2mm) and Wiltshire (196.5mm), all recorded more than three times (300%) their average September rainfall.
September 2024 was Bedfordshire and Oxfordshire’s wettest calendar month, in a series dating back to 1836.
Southern England had its wettest September since 1918, and its third wettest on record in a series from 1836.
Rainfall and climate change
Rainfall has a large amount of natural variability in the UK’s climate, with long-term trends harder to detect in monthly data. While September’s rainfall data shows no clear trend, there are longer-term climate signals in wider rainfall datasets.
For example, the State of the UK Climate 2023 report says that five of the ten wettest years for the UK, in the series from 1836, have occurred in the 21st century. Plus, the most recent decade, (2014-2023), has been 10% wetter than 1961-1990.
The below graph shows UK rainfall trends for September from 1836.
As our atmosphere warms it can hold more moisture, roughly 7% more per 1°C of warming. This can lead to more intense and frequent downpours. In autumn, the UK will likely see more days with rainfall totals over 50mm, particularly for western areas of the UK. It is important to note that there are other factors that contribute to flooding, such as land use, local hydrology and preceding conditions.
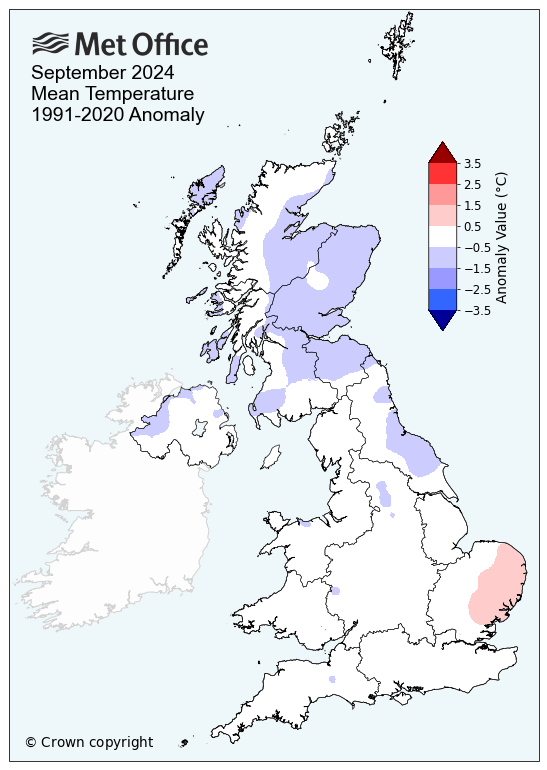
Below average temperatures
Overall, September saw below average temperatures for the UK, with a mean of 12.7°C, which is 0.3°C below the long-term meteorological average for the month.
Temperatures were slightly lower in Scotland and Northern Ireland, than they were in southern and central England.
The month began on a warm note, with above average temperatures across the UK persisting for the first week. However, by the second week, the temperature dropped as Arctic air moved in. The third week saw a return to above average temperatures, with places in western Scotland reaching 25°C, before a return to much cooler conditions in the final week of the month.
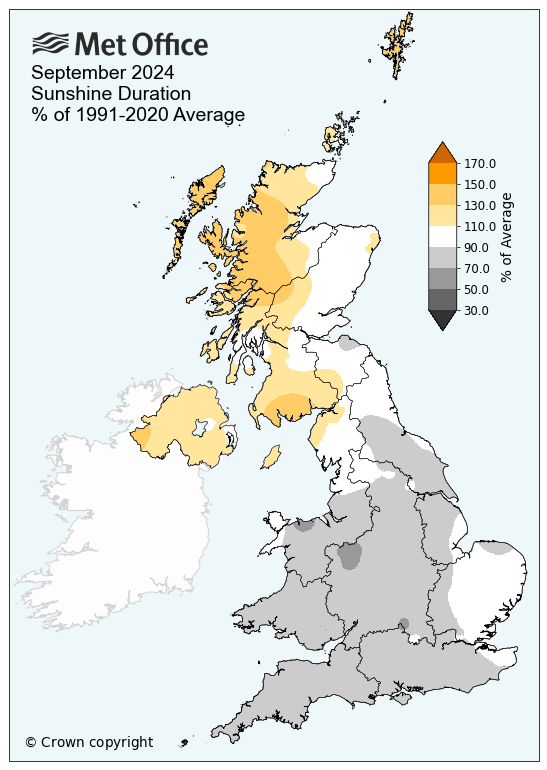
September sunshine
September was an average month for sunshine, with the UK experiencing 122.7 hours, 4% less than average.
For Scotland and Northern Ireland, it was a particularly sunny September. Scotland saw 18% more sunshine and Northern Ireland 17% more than the monthly average.
|
Provisional September 2024 stats |
Max temp (°C) |
Min temp (°C) |
Mean temp (°C) |
Rainfall (mm/%) |
Sunshine (hours/ %) |
|||||
|
Actual |
91/20 anom |
Actual |
91/20 anom |
Actual |
91/20 anom |
Actual |
91/20 anom |
Actual |
91/20 anom |
|
|
UK |
16.4 | -0.4 | 8.9 | -0.1 | 12.7 | -0.3 | 114.1 | 125 | 122.7 | 96 |
|
England |
17.6 | -0.5 | 10.0 | 0.3 | 13.8 | -0.1 | 133.5 | 195 | 122.6 | 87 |
|
Wales |
16.1 | -0.8 | 9.5 | 0.2 | 12.8 | -0.3 | 155.2 | 139 | 104.8 | 81 |
|
Scotland |
14.5 | -0.3 | 7.0 | -0.9 | 10.7 | -0.6 | 78.1 | 63 | 125.7 | 118 |
|
Northern Ireland |
15.9 | -0.4 | 8.5 | -0.4 | 12.1 | -0.4 | 71.6 | 82 | 132.5 | 117 |