2020 - a remarkable year
Author: Press Office
15:39 (UTC) on Mon 4 Jan 2021
2020 was notable for being ranked in the top ten for mean temperature, rainfall, and sunshine.
Early figures show it was the third warmest year in records dating back to 1884, beaten only by 2014 and 2006, and marginally warmer than 2011. It was also provisionally the sixth wettest year for the UK in records back to 1862, and the 8th sunniest year since 1919.
Professor Peter Stott, a Met Office research Fellow in climate change attribution, said: “All top-ten warmest years on record for the UK have occurred since 2002, and 2020 has continued to be consistent with this pattern. The general trend of warming as a consequence of climate change is clearly to be seen, not just at a global level, but in our own national temperature records too.”
| Area | Mean Temp (24-hour average) | Rainfall | Sunshine | |||
|---|---|---|---|---|---|---|
| ° C | Difference from average | mm | % compared to average | Hours | % compared to average | |
| UK | 9.62 | 0.77 | 1308.1 | 114 | 1495.2 | 109 |
| England | 10.58 | 0.92 | 953.8 | 112 | 1680.2 | 113 |
| Wales | 9.92 | 0.79 | 1680.4 | 115 | 1471.4 | 105 |
| Scotland | 8.00 | 0.58 | 1796.6 | 115 | 1233.0 | 104 |
| Northern Ireland | 9.30 | 0.38 | 1307.4 | 115 | 1272.8 | 101 |

For more information on the weather events of 2020, take a look back at 2020.
December statistics
December 2020 was generally an unsettled and mild month, but some colder spells brought us a white Christmas with parts of Suffolk, Cambridgeshire, Yorkshire and Northumberland seeing snowfall on the 25th.
Rainfall
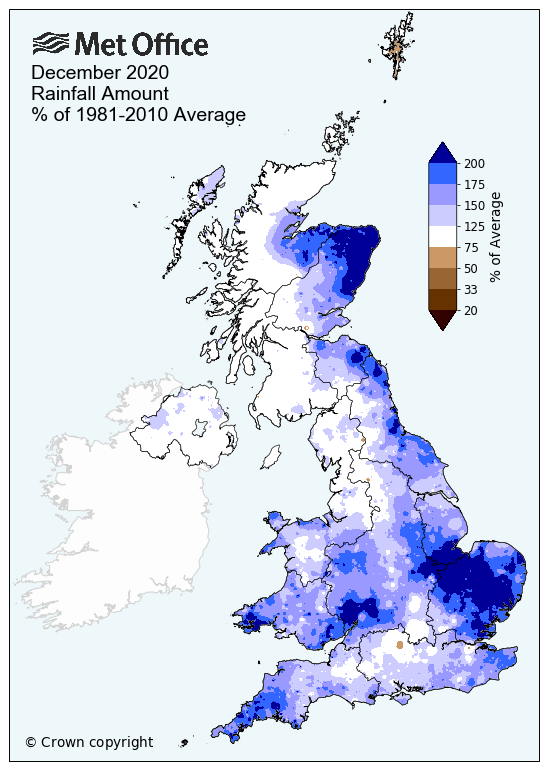
All regions of the UK received more than their expected average rainfall with some eastern areas actually exceeding their normal December rainfall by the middle of the month. South England and Wales received the most rainfall with Wales receiving 155% (256.2mm) and South England 162% (131mm). The only regions closer to normal were Western Scotland 105% (199.2mm) and Northern Ireland 113% (129mm).
It was a particularly wet month across parts of north-east Scotland and East Anglia with more than twice the normal rainfall in places. Writtle in Essex had its wettest December in 87 years while Cardiff also had a wet month with its wettest December in 72 years.
| Area | Actual rainfall | % of the December average |
|---|---|---|
| UK | 162.1mm | 135 |
| England | 130.6mm | 150 |
| Wales | 256.2mm | 155 |
| Scotland | 195.6mm | 120 |
| Northern Ireland | 129.0mm | 113 |

Heavy rains led to flooding in Bedfordshire on Christmas Eve with homes being evacuated. Storm Bella brought more heavy rain and strong winds to parts of the UK on December 26th with a wind gust of 106 mph being recorded on the Isle of Wight, the highest gust recorded in 2020. The map below shows the amount of rainfall on the 26th December.

Sunshine
December sunshine totals were rather below normal across many parts of the UK with Wales receiving just 28.8 hours (69%) for the month. Counties Dorset and Orkney received the most sunshine with Dorset 125% (67.6 hours) and Orkney 125% (30.2 hours).
| Area | Actual rainfall | % of the December average |
|---|---|---|
| UK | 37.8 | 93 |
| England | 26.5 | 98 |
| Wales | 28.8 | 69 |
| Scotland | 26.1 | 87 |
| Northern Ireland | 34.2 | 93 |

Temperatures
Overall, the month was a mild one with mean temperatures (24 hour total) for England, Wales and Scotland between + 0.4°C and + 0.6°C warmer than average. Northern Ireland remained close to normal being -0.1°C cooler than average.
| Area | Maximum temperature | Minimum temperature | ||
|---|---|---|---|---|
| Actual °C | Difference from Dec average °C | Actual °C | Difference from Dec average °C | |
| UK | 6.8 | 0.2 | 1.9 | 0.8 |
| England | 7.4 | 0.2 | 2.2 | 0.7 |
| Wales | 7.4 | 0.2 | 2.4 | 0.7 |
| Scotland | 5.7 | 0.2 | 1.1 | 1.1 |
| Northern Ireland | 7.0 | -0.4 | 1.9 | 0.1 |
You can get the most accurate and up to date forecast for your area using our forecast pages and by following us on Twitter and Facebook, as well as using our mobile app, which is available for iPhone from the App store and for Android from the Google Play store. You can check the latest weather warnings on our severe weather warnings pages.
For the latest guidance to follow during the COVID-19 pandemic please visit the UK Government’s coronavirus advice page. Those living in Scotland, Wales and Northern Ireland can access country-specific advice.


