
Maintained by: Caroline Sandford
Last updated: 18/03/2026 Expires: 18/03/2027
Hosted by: Met Office Hadley Centre
© Crown Copyright
| Met Office Hadley Centre observations datasets |
| > Home > HadSST4 > |
The following diagrams are updated diagnostics using HadSST.4.2.0.0.
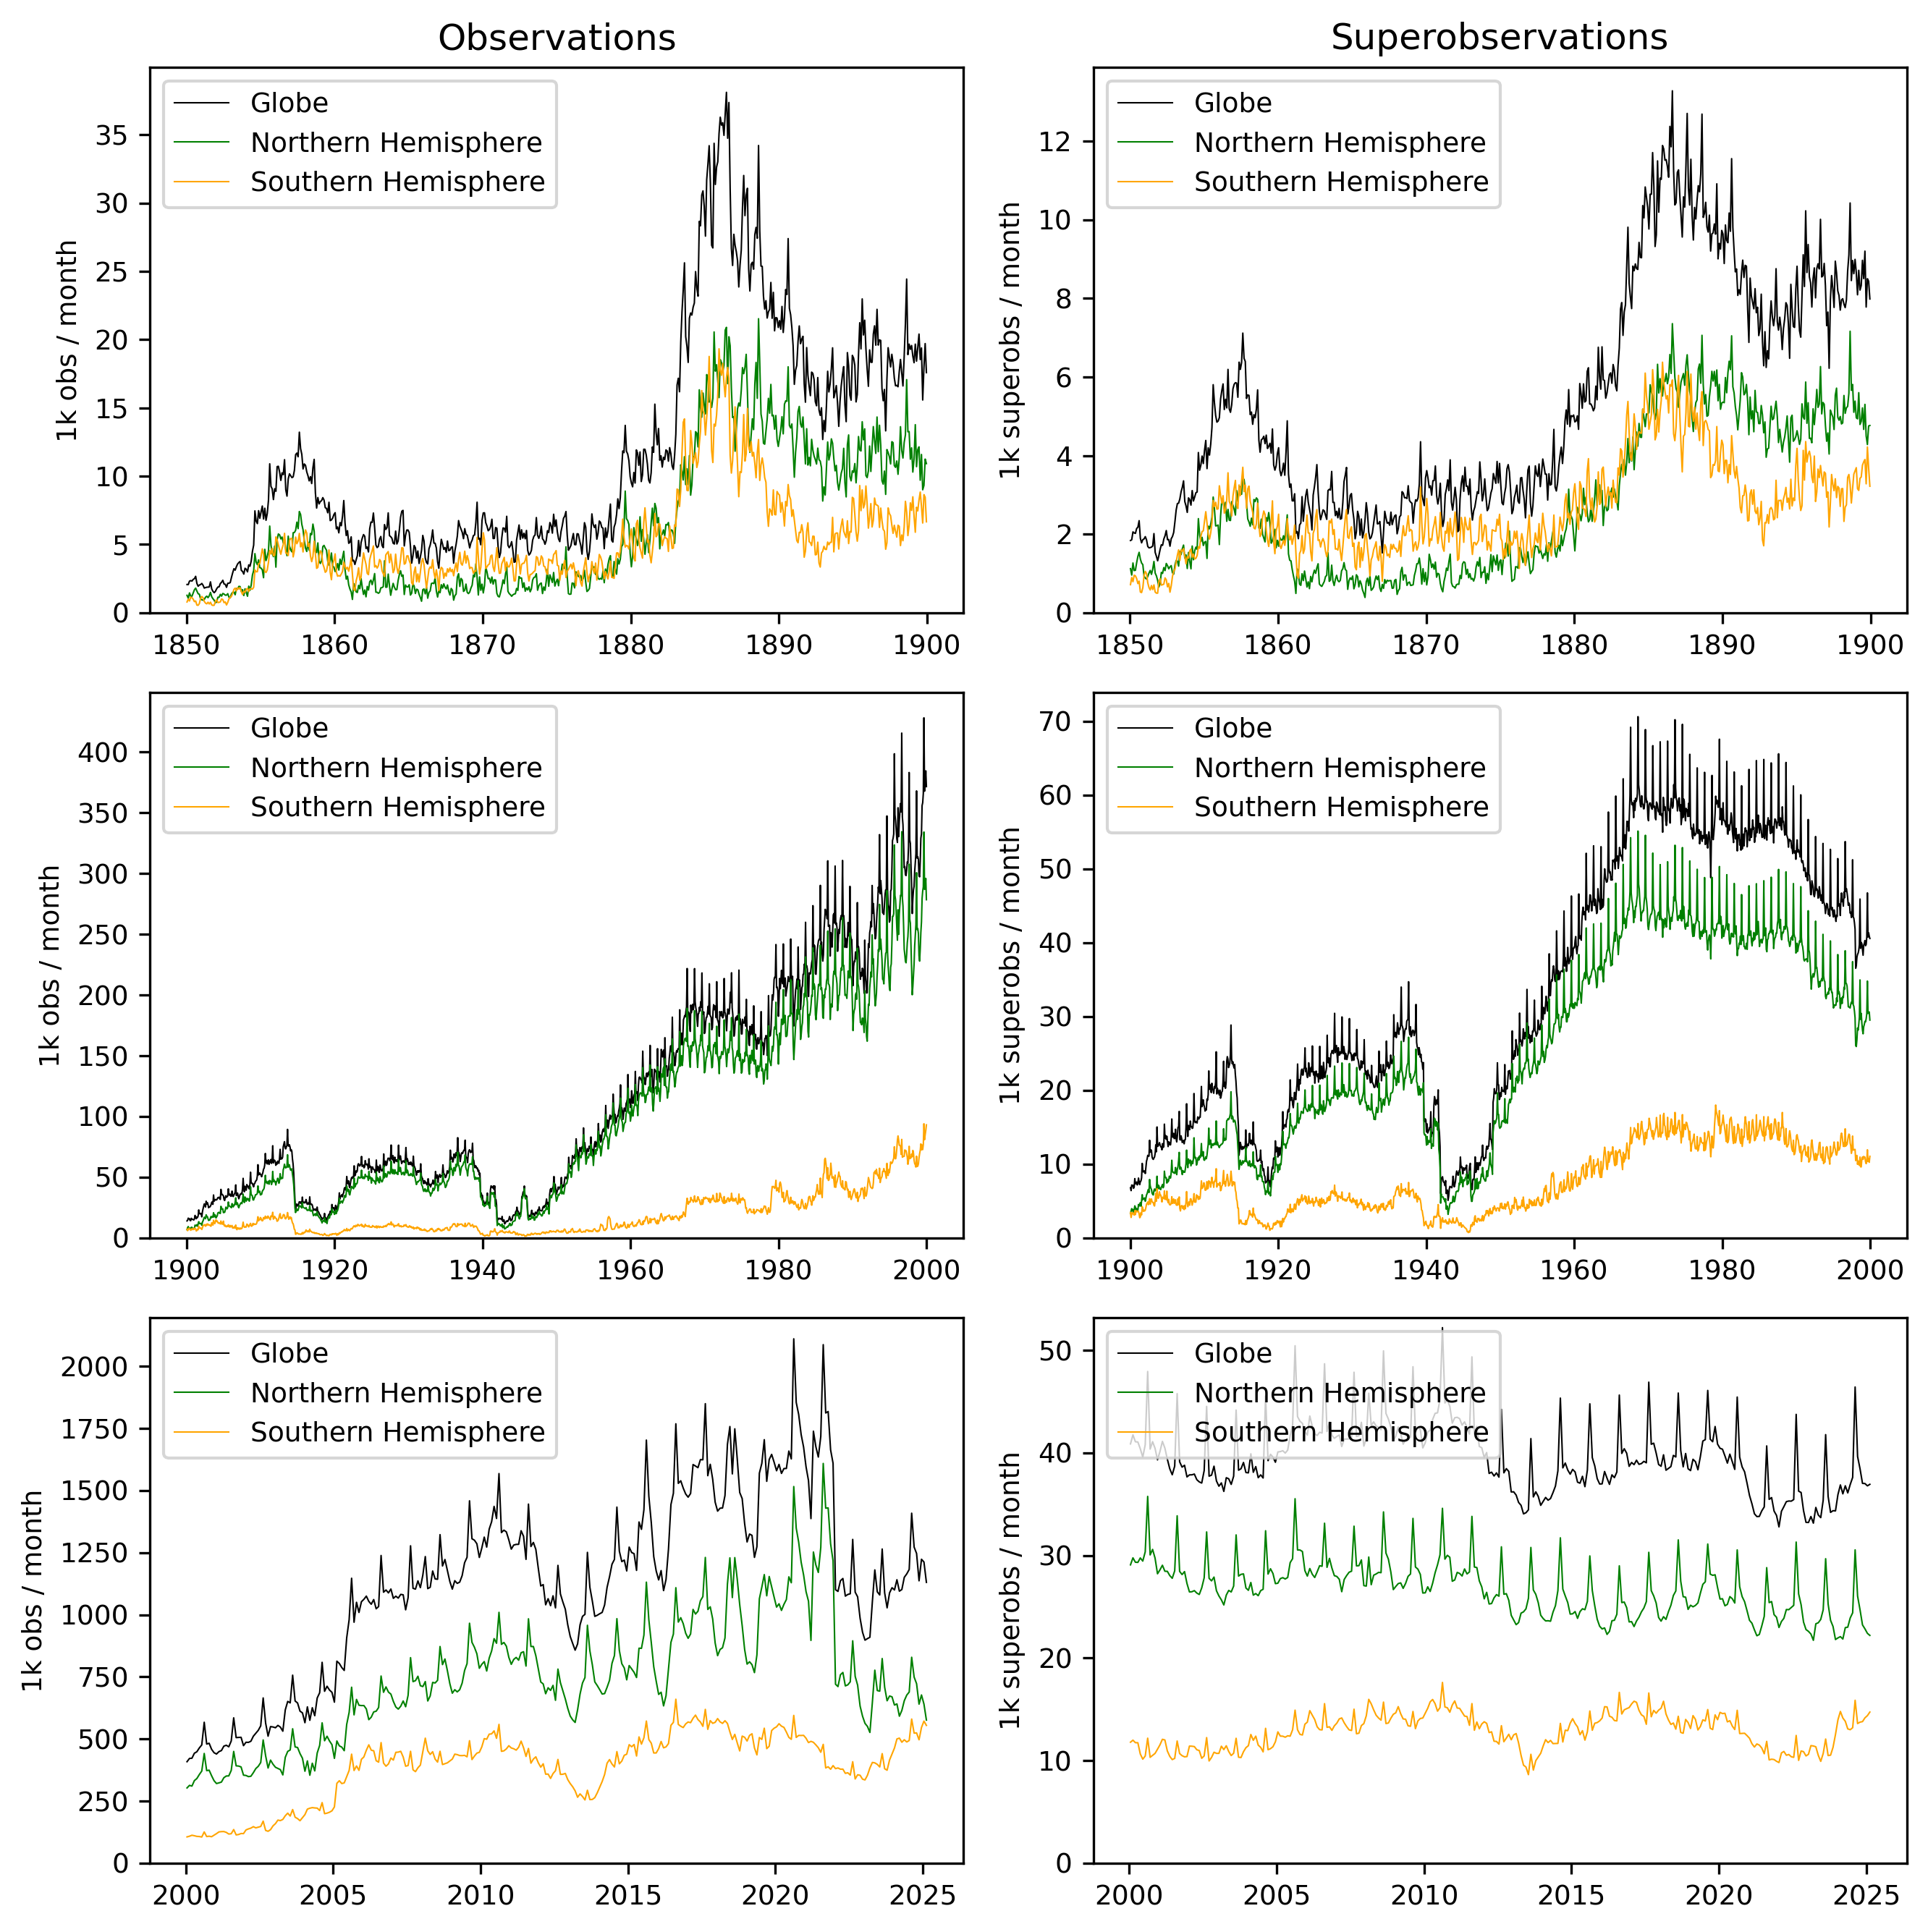
Figure 1: Numbers of observations passing QC (left) and super-observations (right) per month for the globe (black), Northern Hemisphere (green) and Southern Hemisphere (orange) for 1850-1880 (top row), 1880-2000 (middle row) and 2000-present (bottom row). Note the very different scales for the y-axes in different periods.
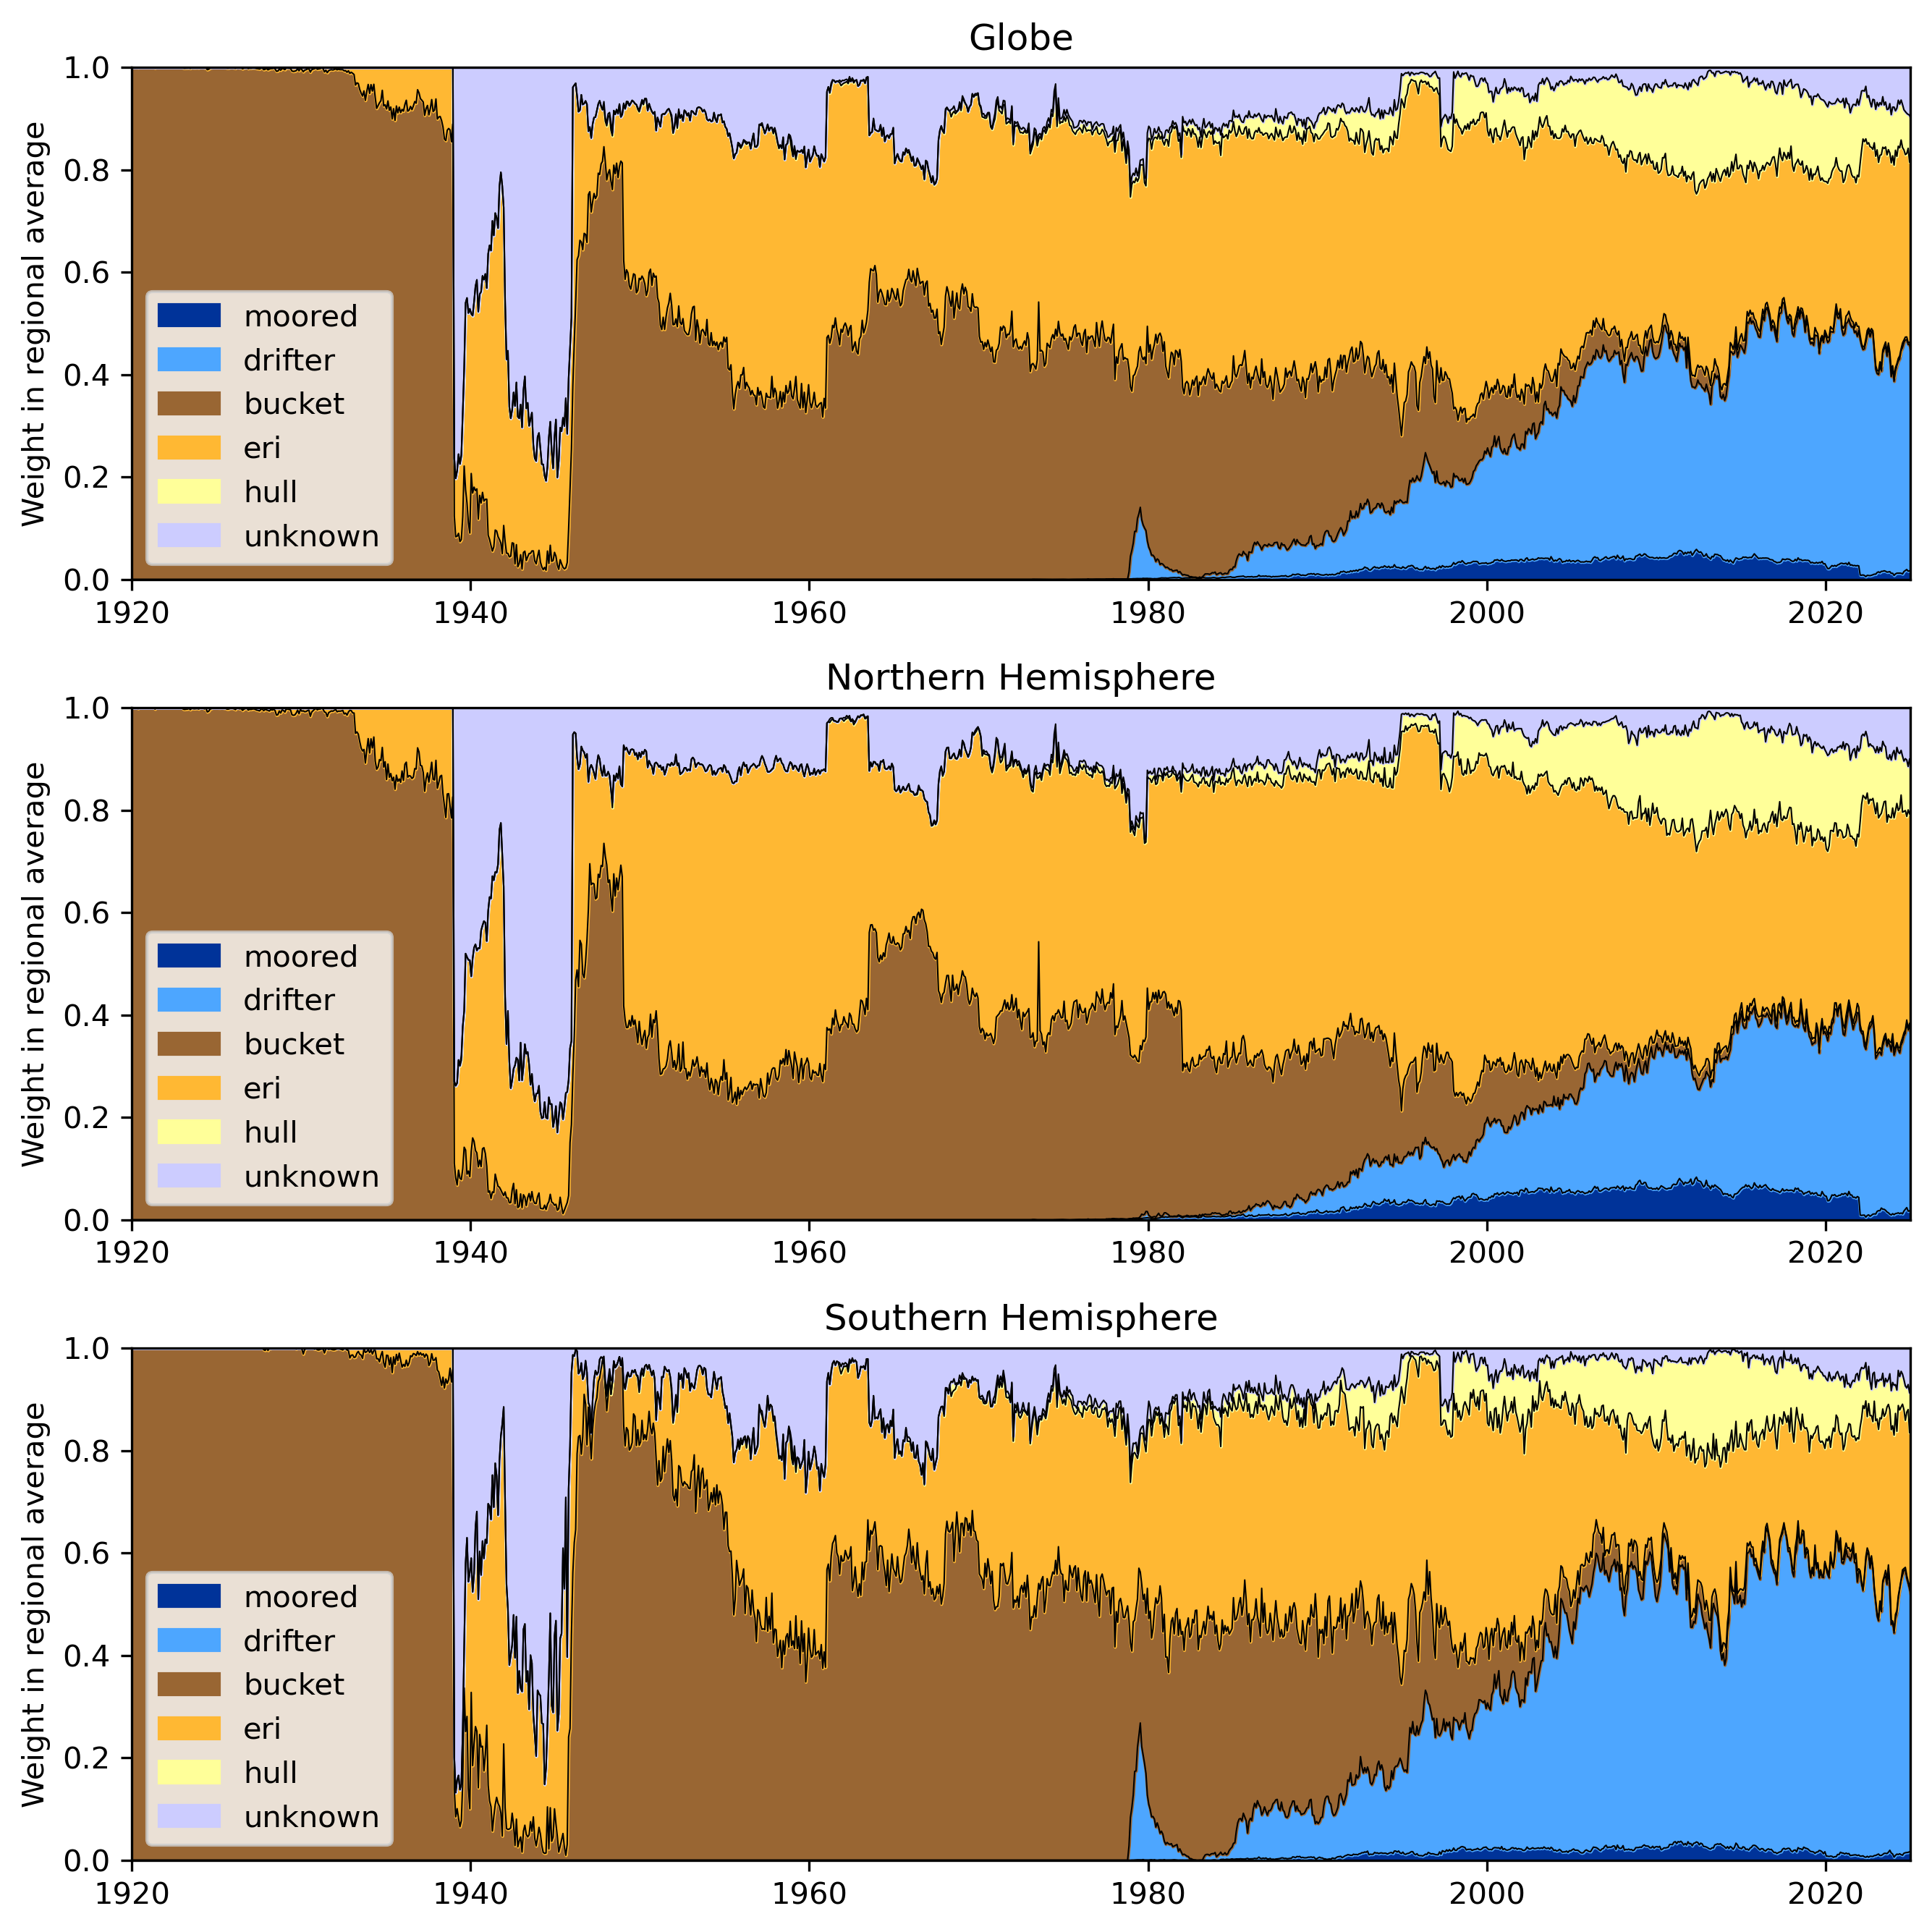
Figure 2: Fractional contribution of different SST observation methods, 1920-present, to the global, Northern and Southern Hemisphere averages. These are the initial assignments including measurements with no assigned method (unknown), and are not the assignments used to calculate the final adjustments.
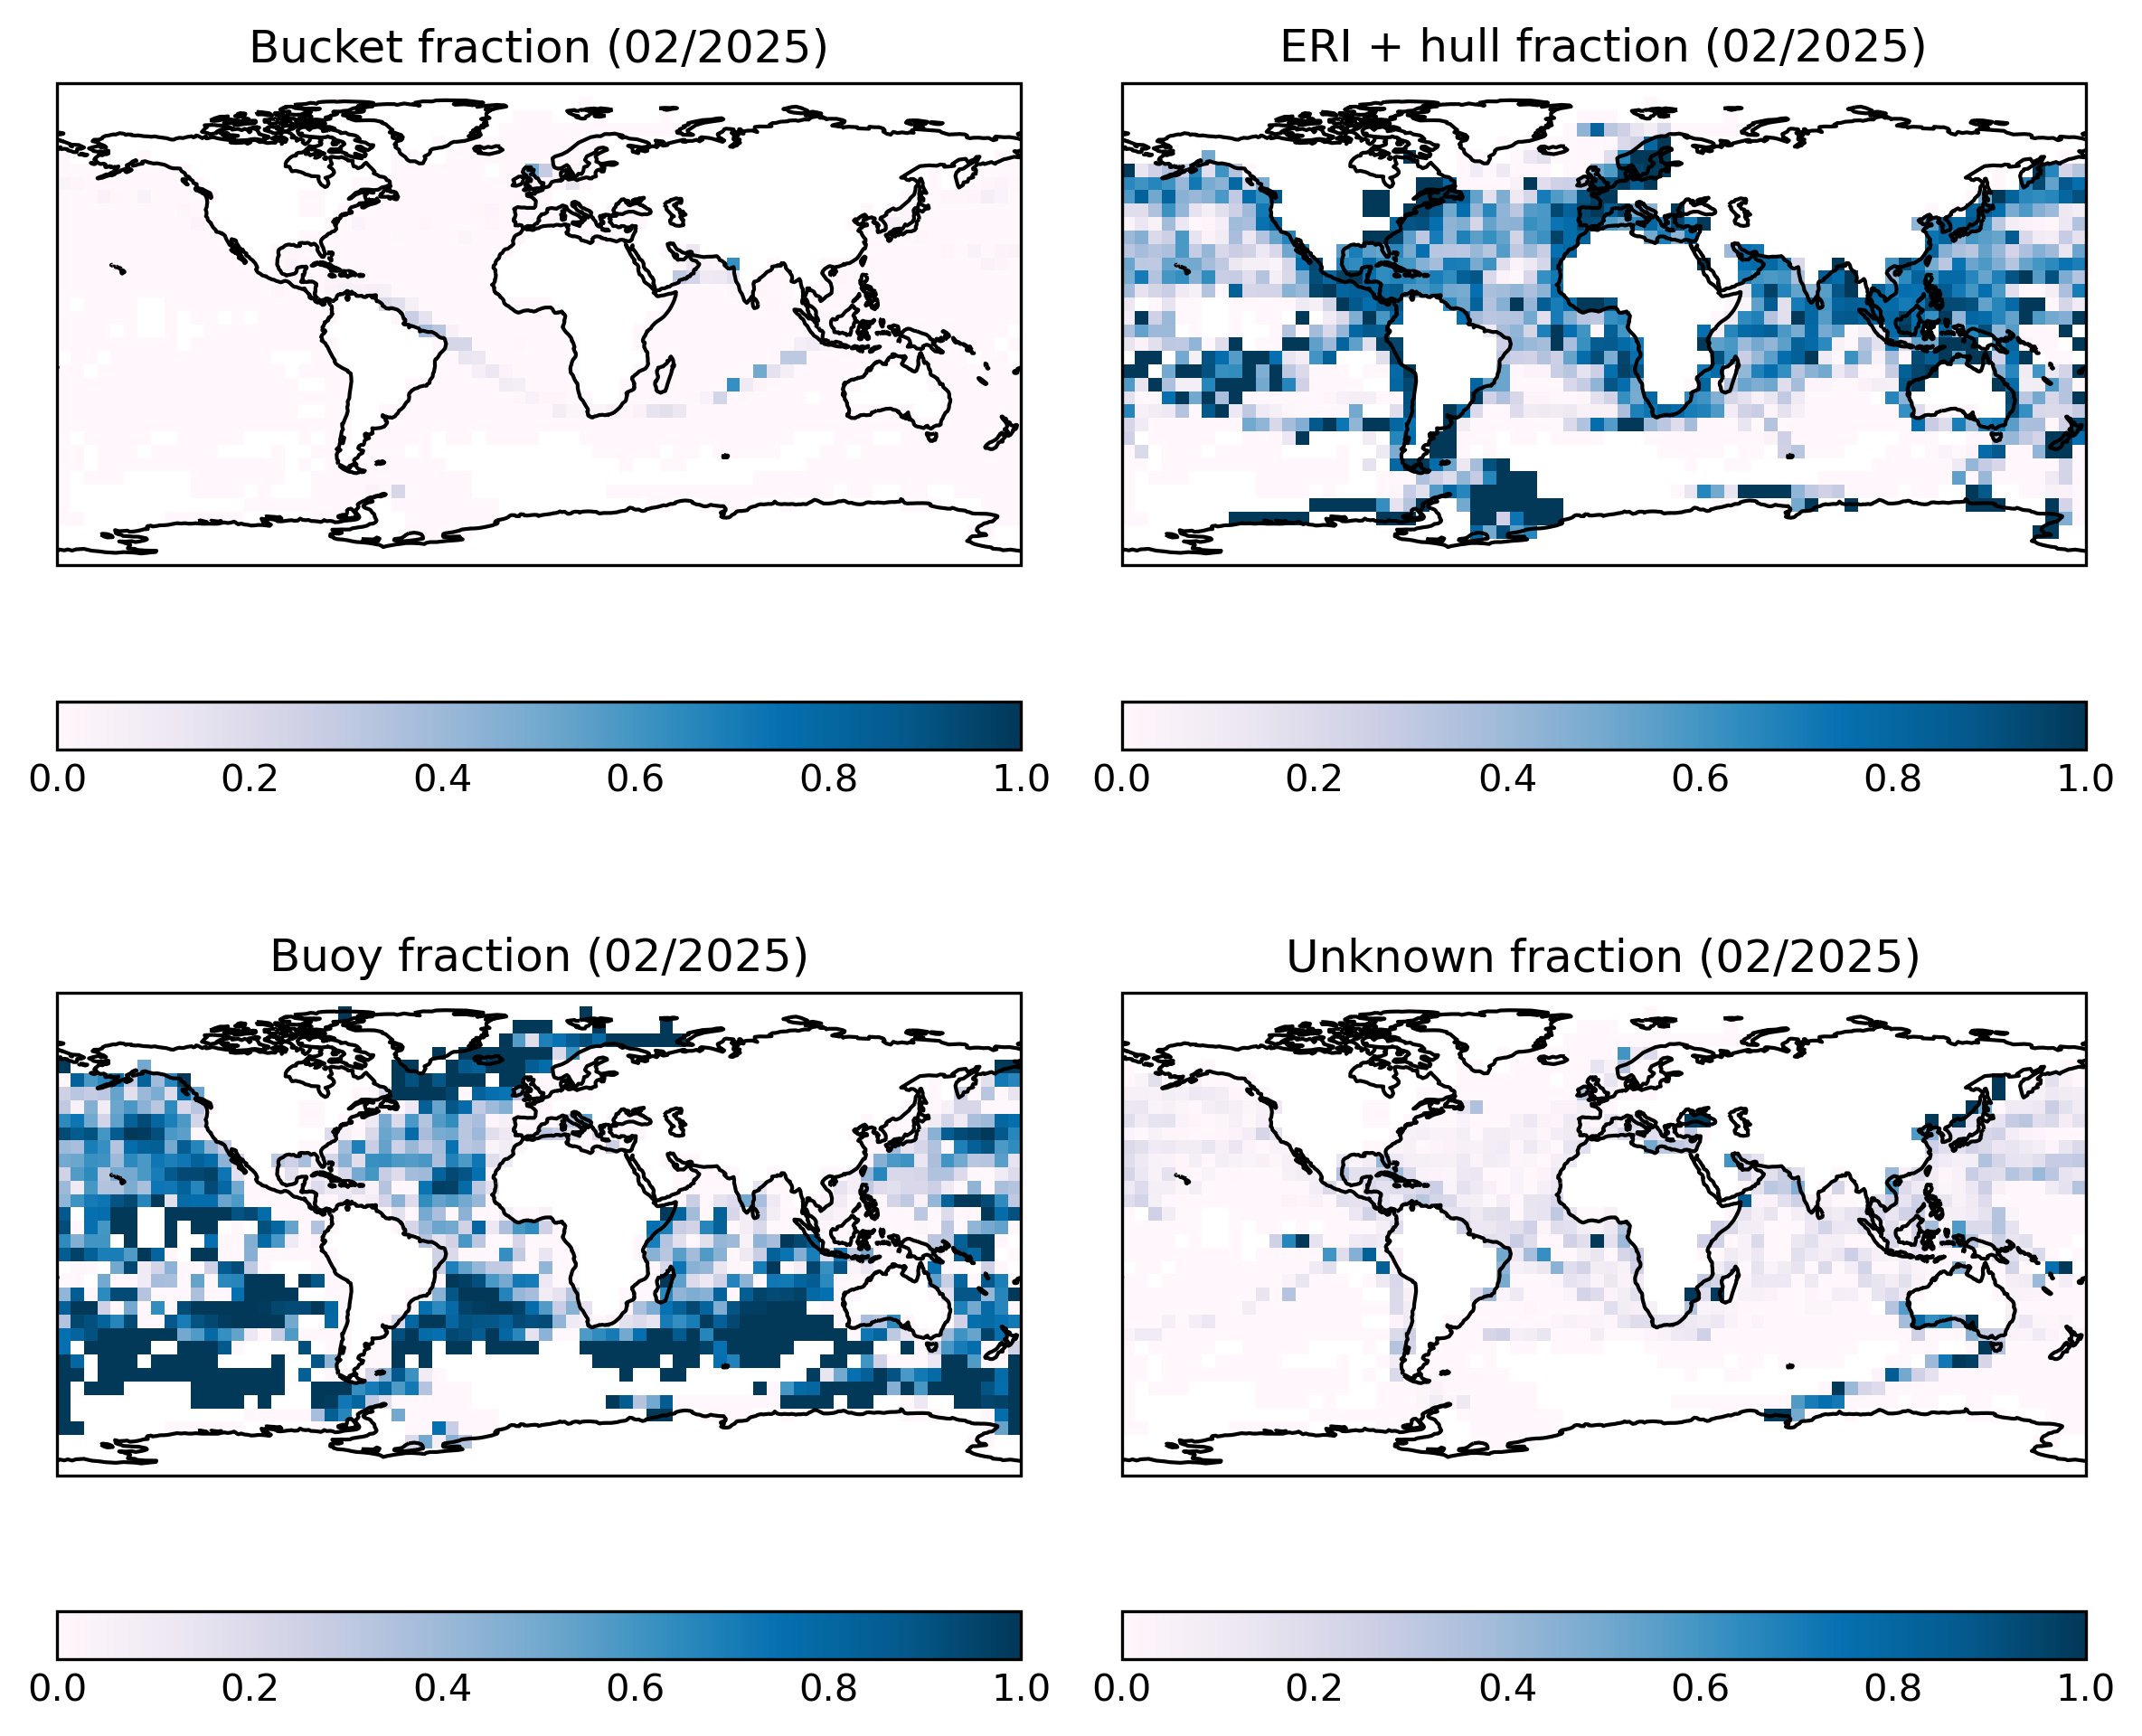
Figure 3: Fractional contribution of different SST observation methods at each 5° by 5° monthly grid point for the latest month.
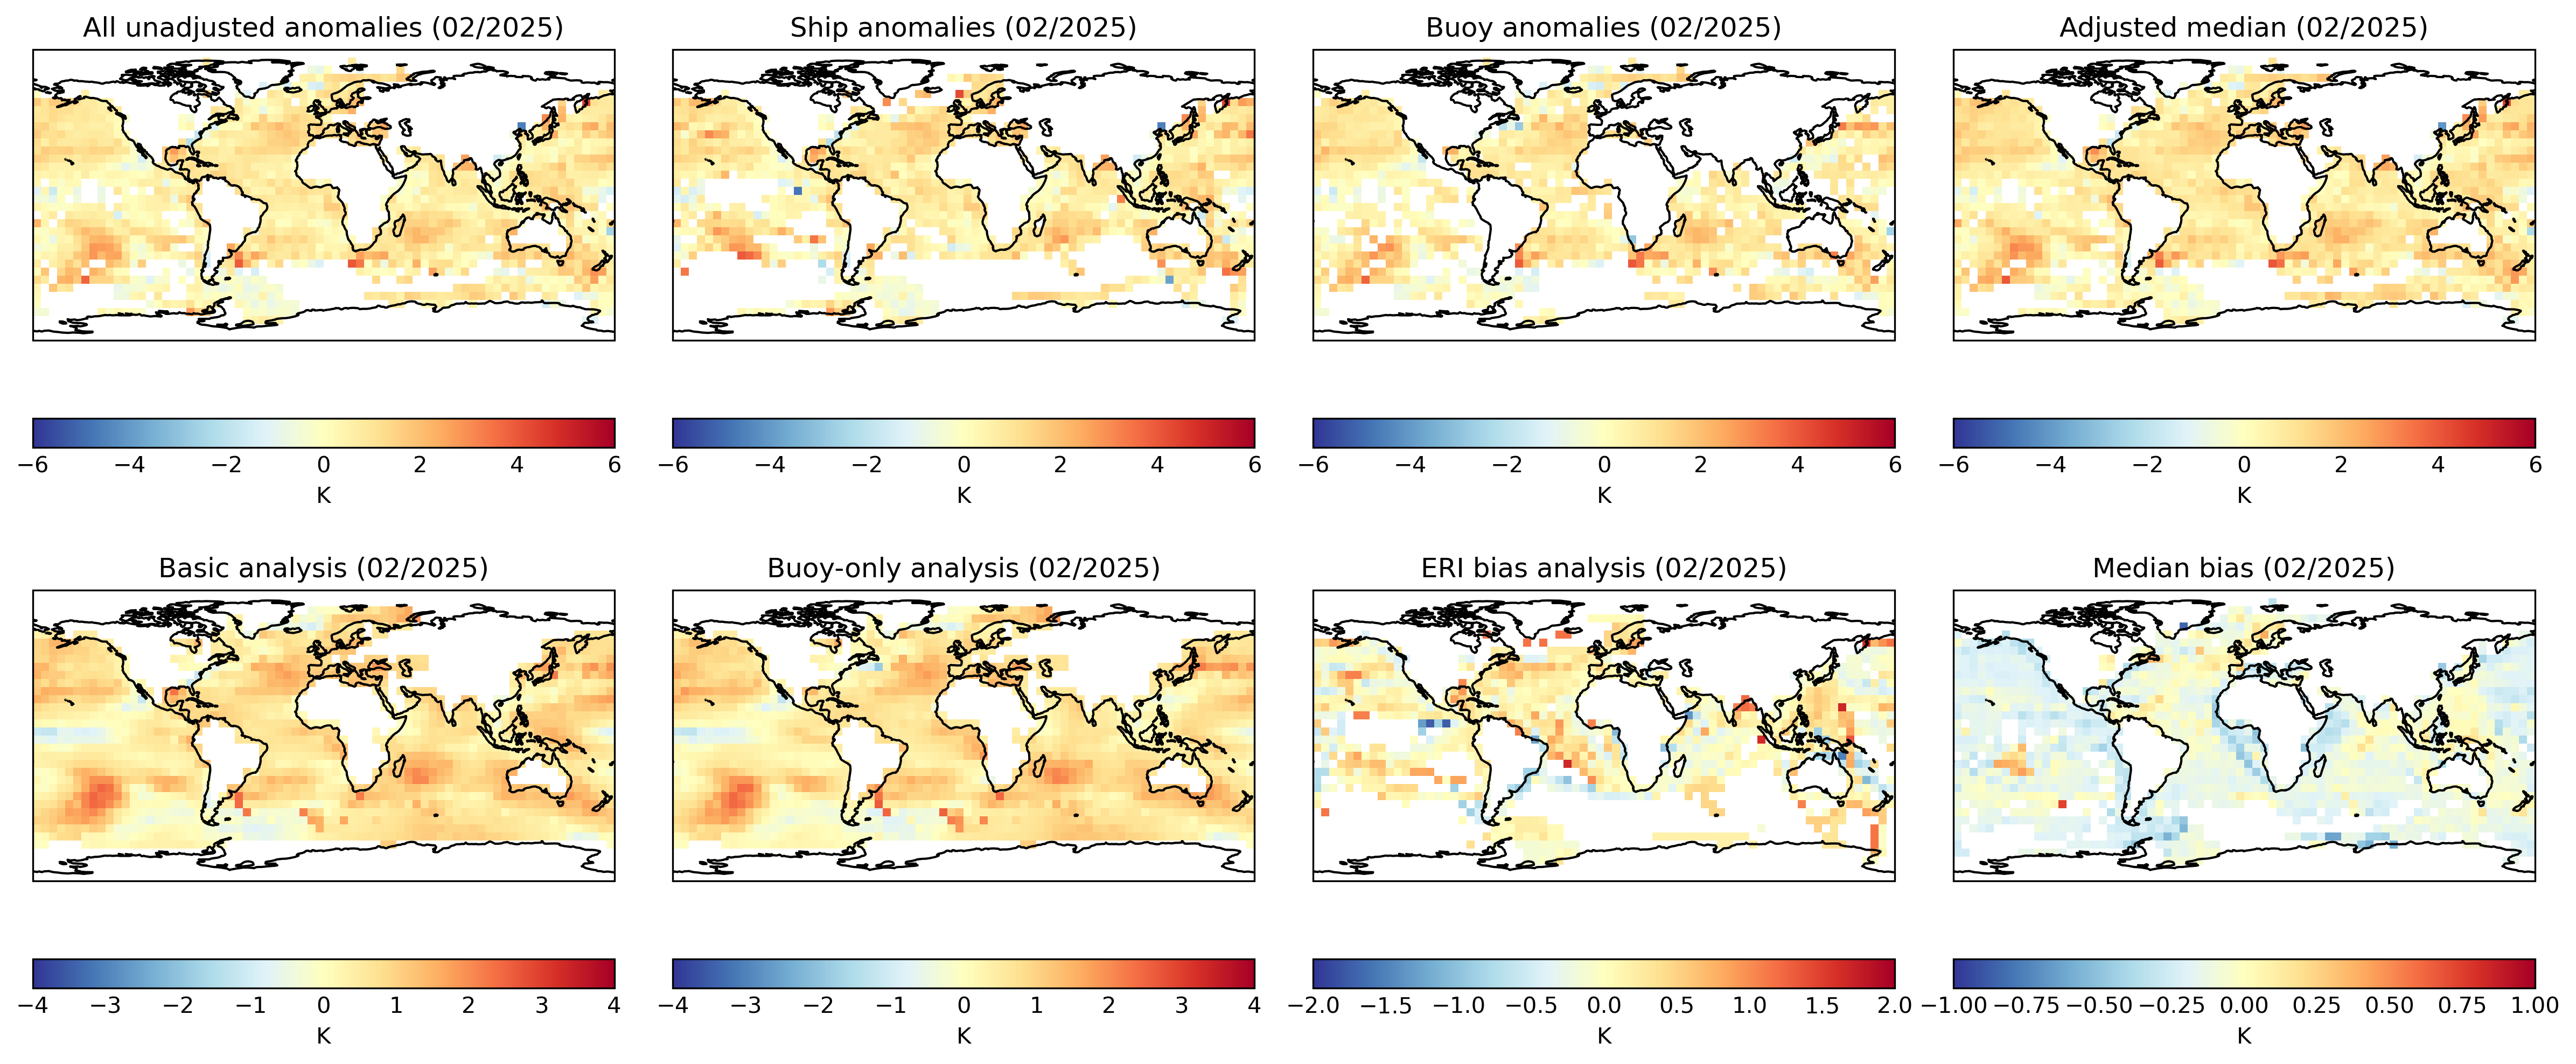
Figure 4: Latest gridded fields of adjusted and unadjusted SSTs and selected bias components on the 5° by 5° monthly grid. Top: unadjusted SSTs from all sources (far left), ship and buoy only (middle), and the bias-adjusted ensemble median (far right). Bottom: interpolated analyses from all measurements (far left) and buoys only (second left); estimated ERI bias (second right); and the median bias subtracted from the original unadjusted data to obtain the adjusted SST ensemble (far right).
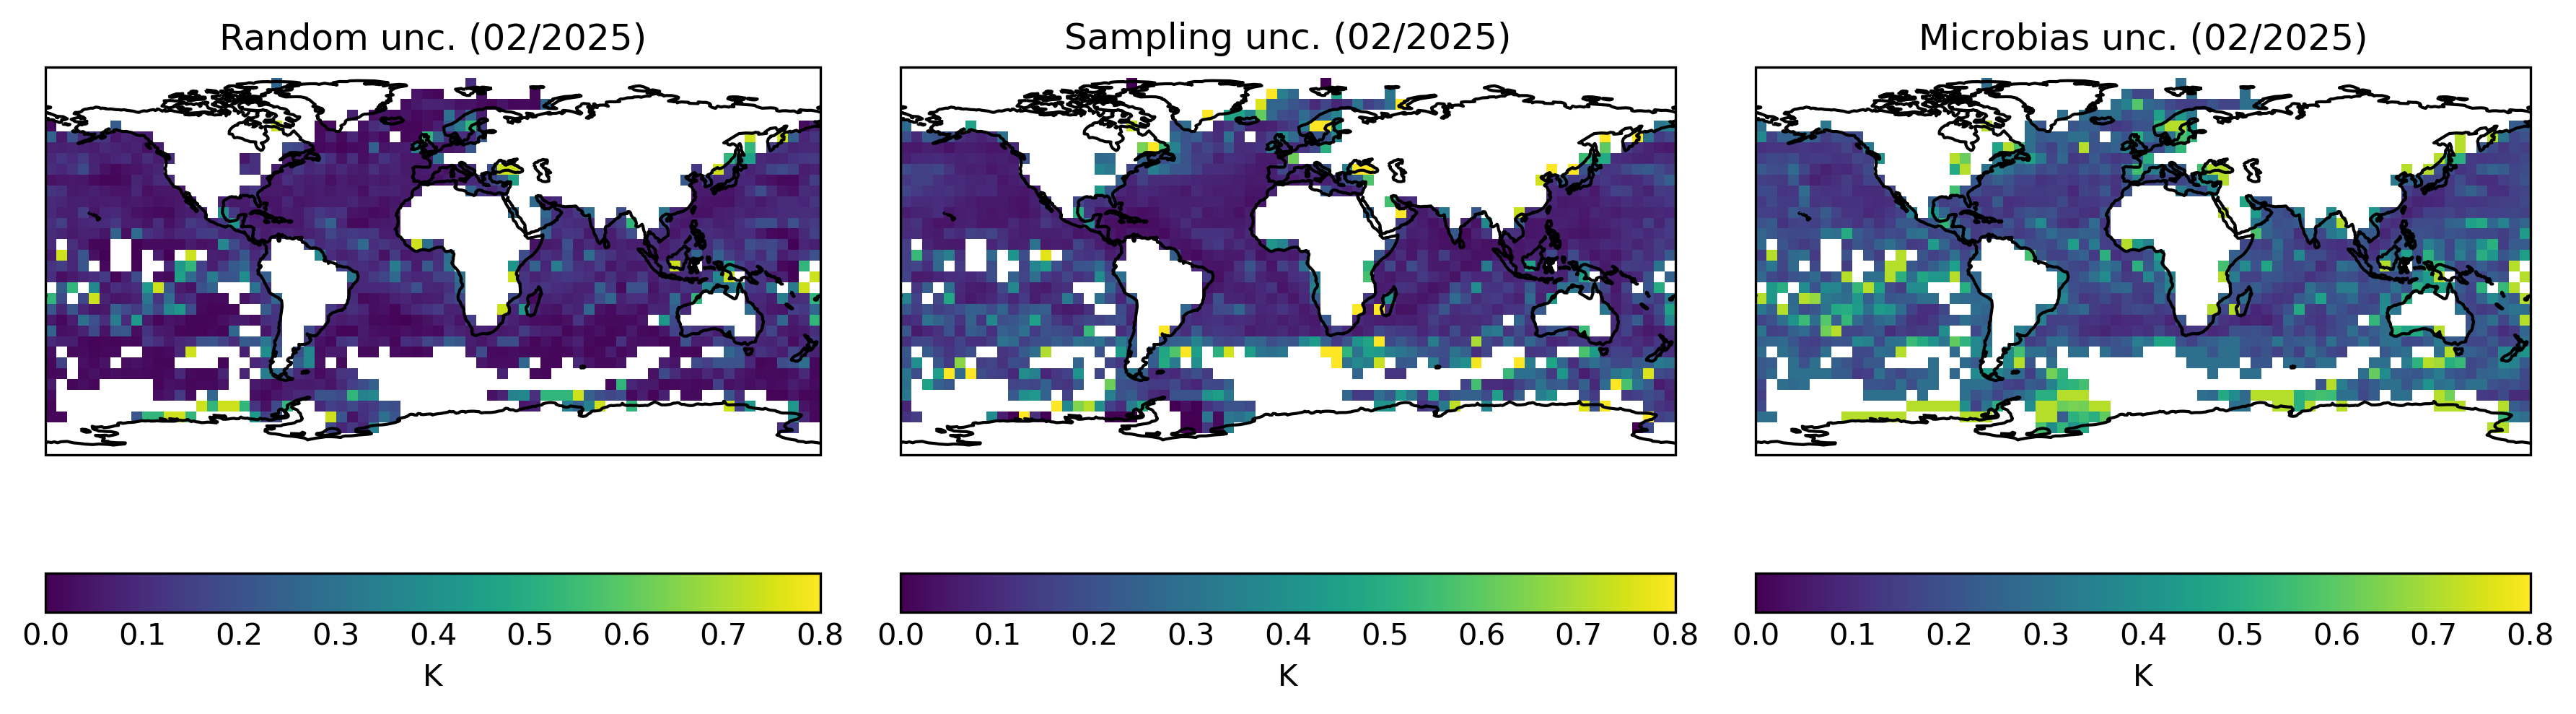
Figure 5: Estimated uncertainties arising from uncorrelated measurement errors (left), sampling uncertainty (middle) and correlated measurement errors (right) on the 5° by 5° monthly grid.
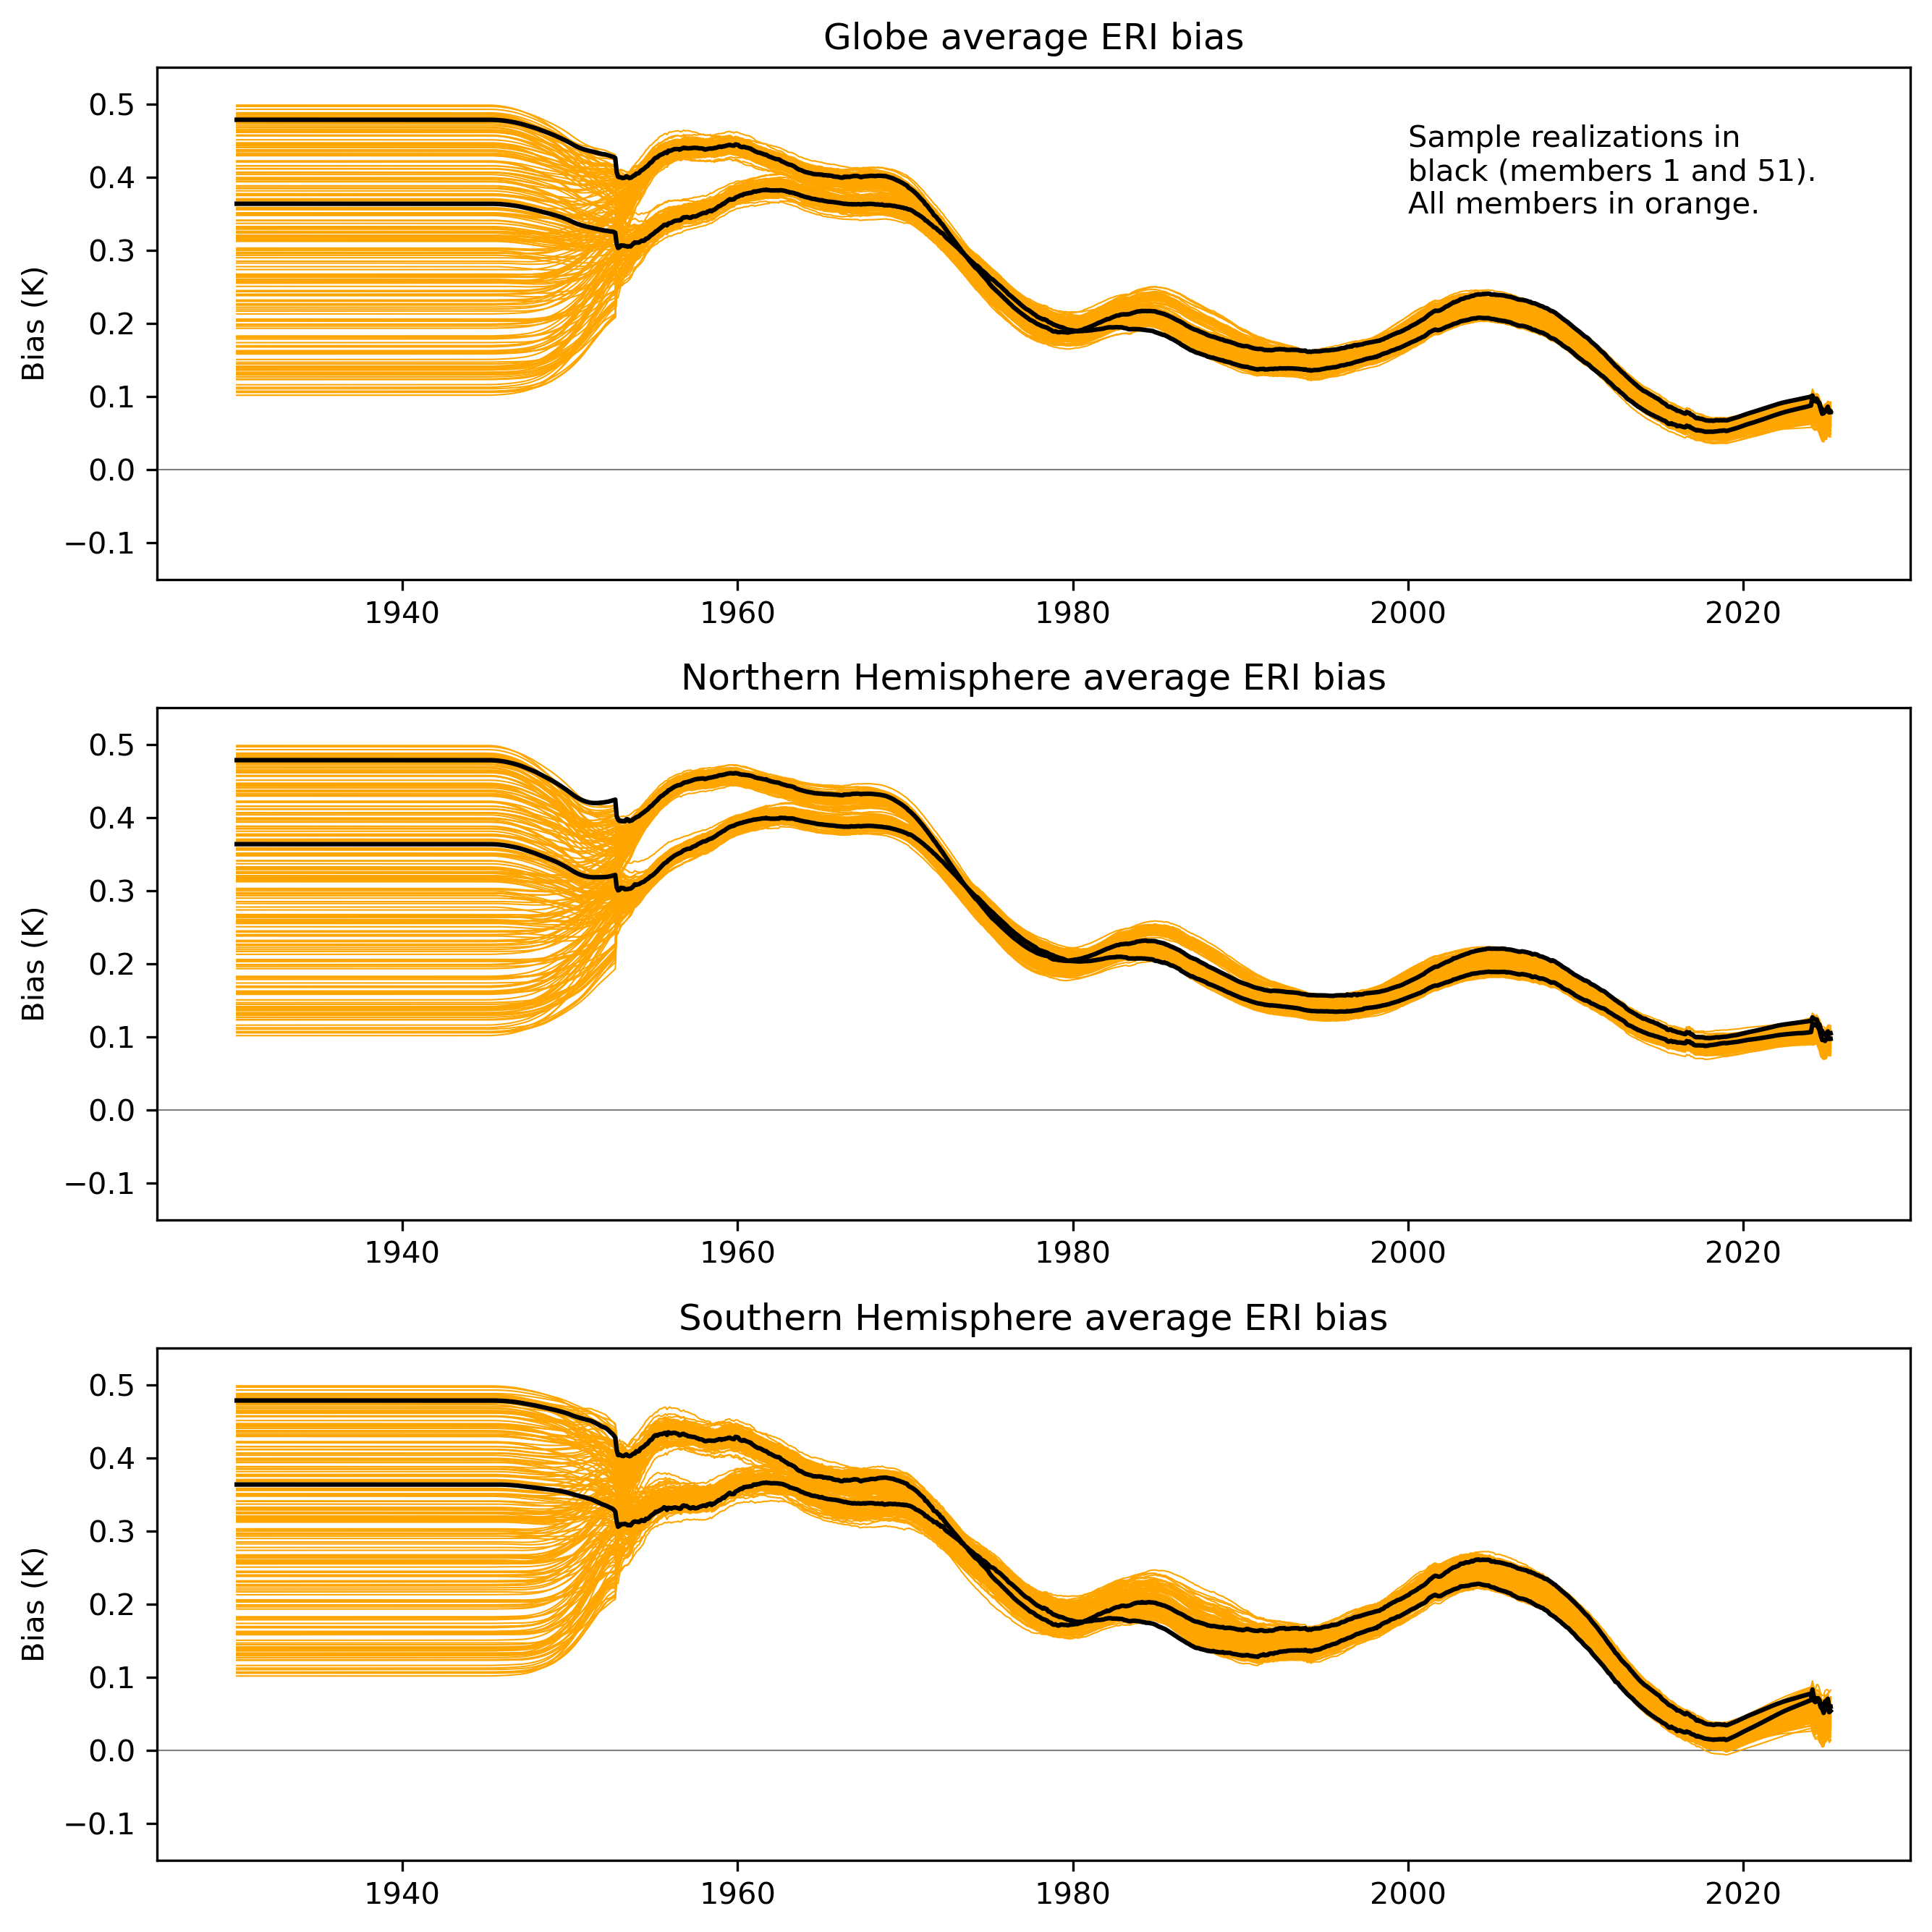
Figure 6: Smoothed estimated monthly ERI biases for the globe, Northern and Southern Hemispheres, 1930-present. The full 200-member ensemble of bias estimates is shown in orange, with two single members overlaid in black for illustration.
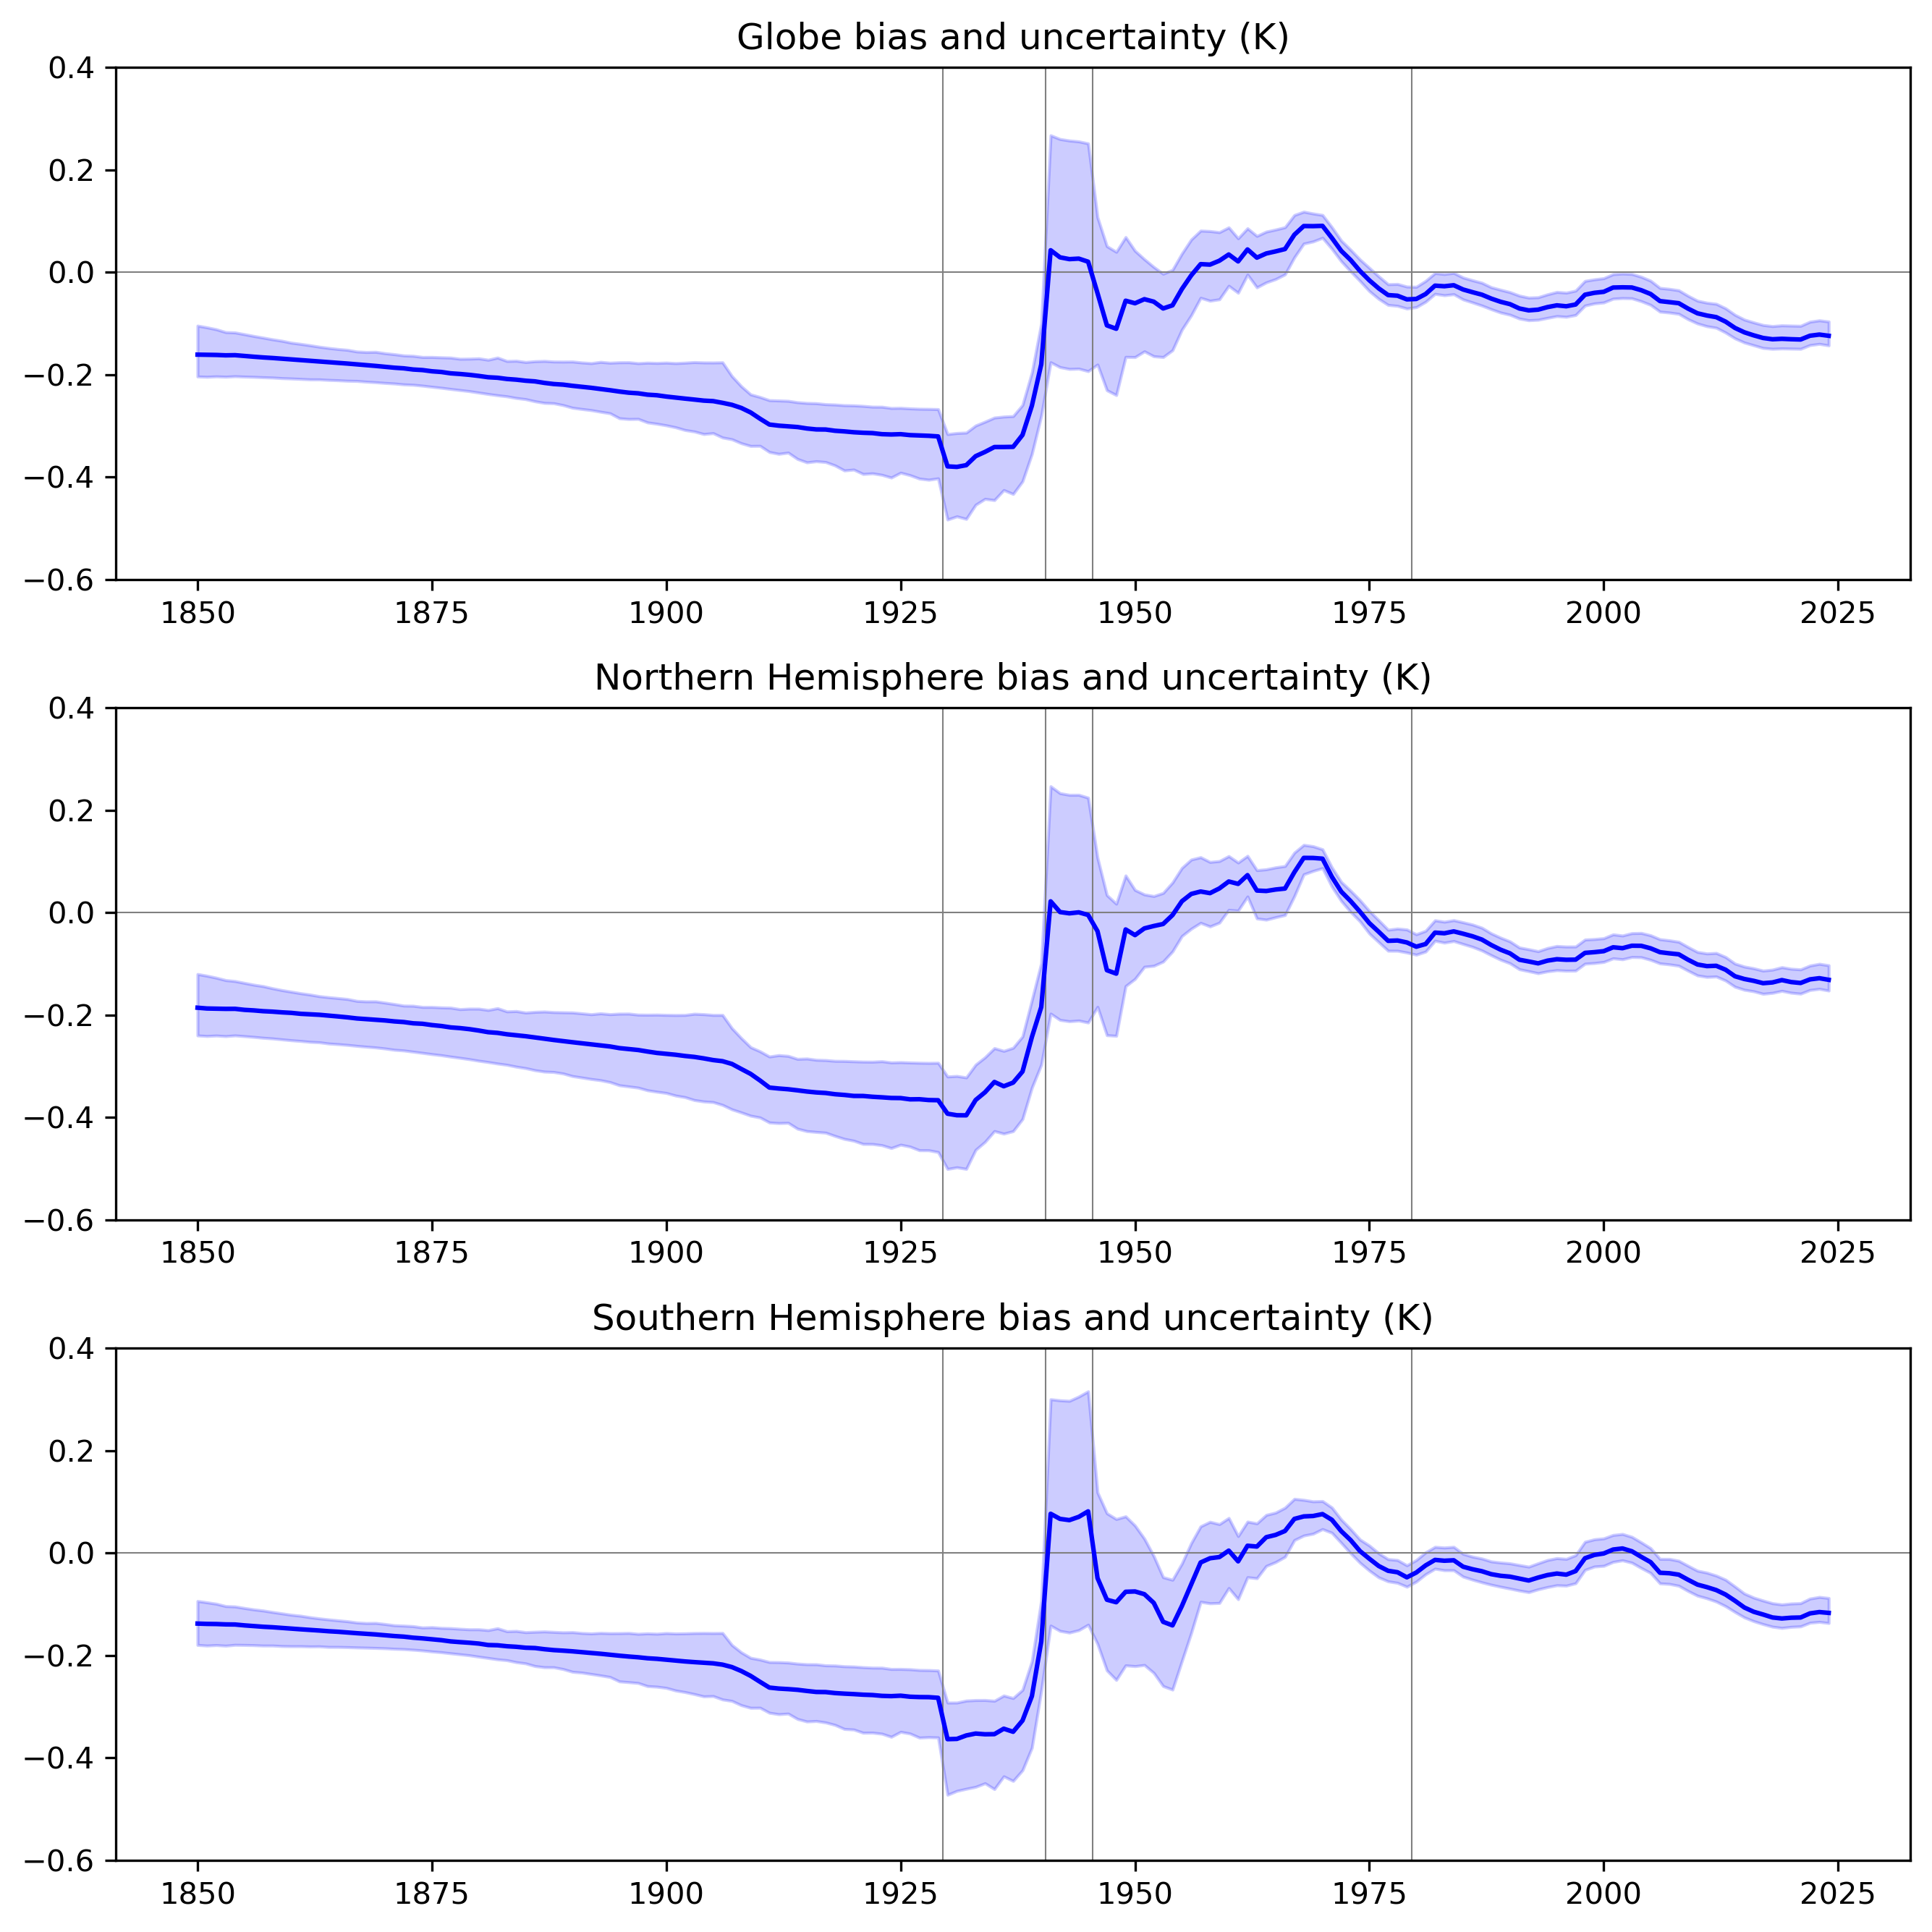
Figure 7: Estimated biases in global, Northern and Southern Hemisphere average SST anomalies for the full gridded dataset, 1850-present, relative to the 1961-1990 average bias. Yearly points are a simple mean of biases over the 12 months in each year. Blue shading represents the 95% range of the 200-member bias ensemble.
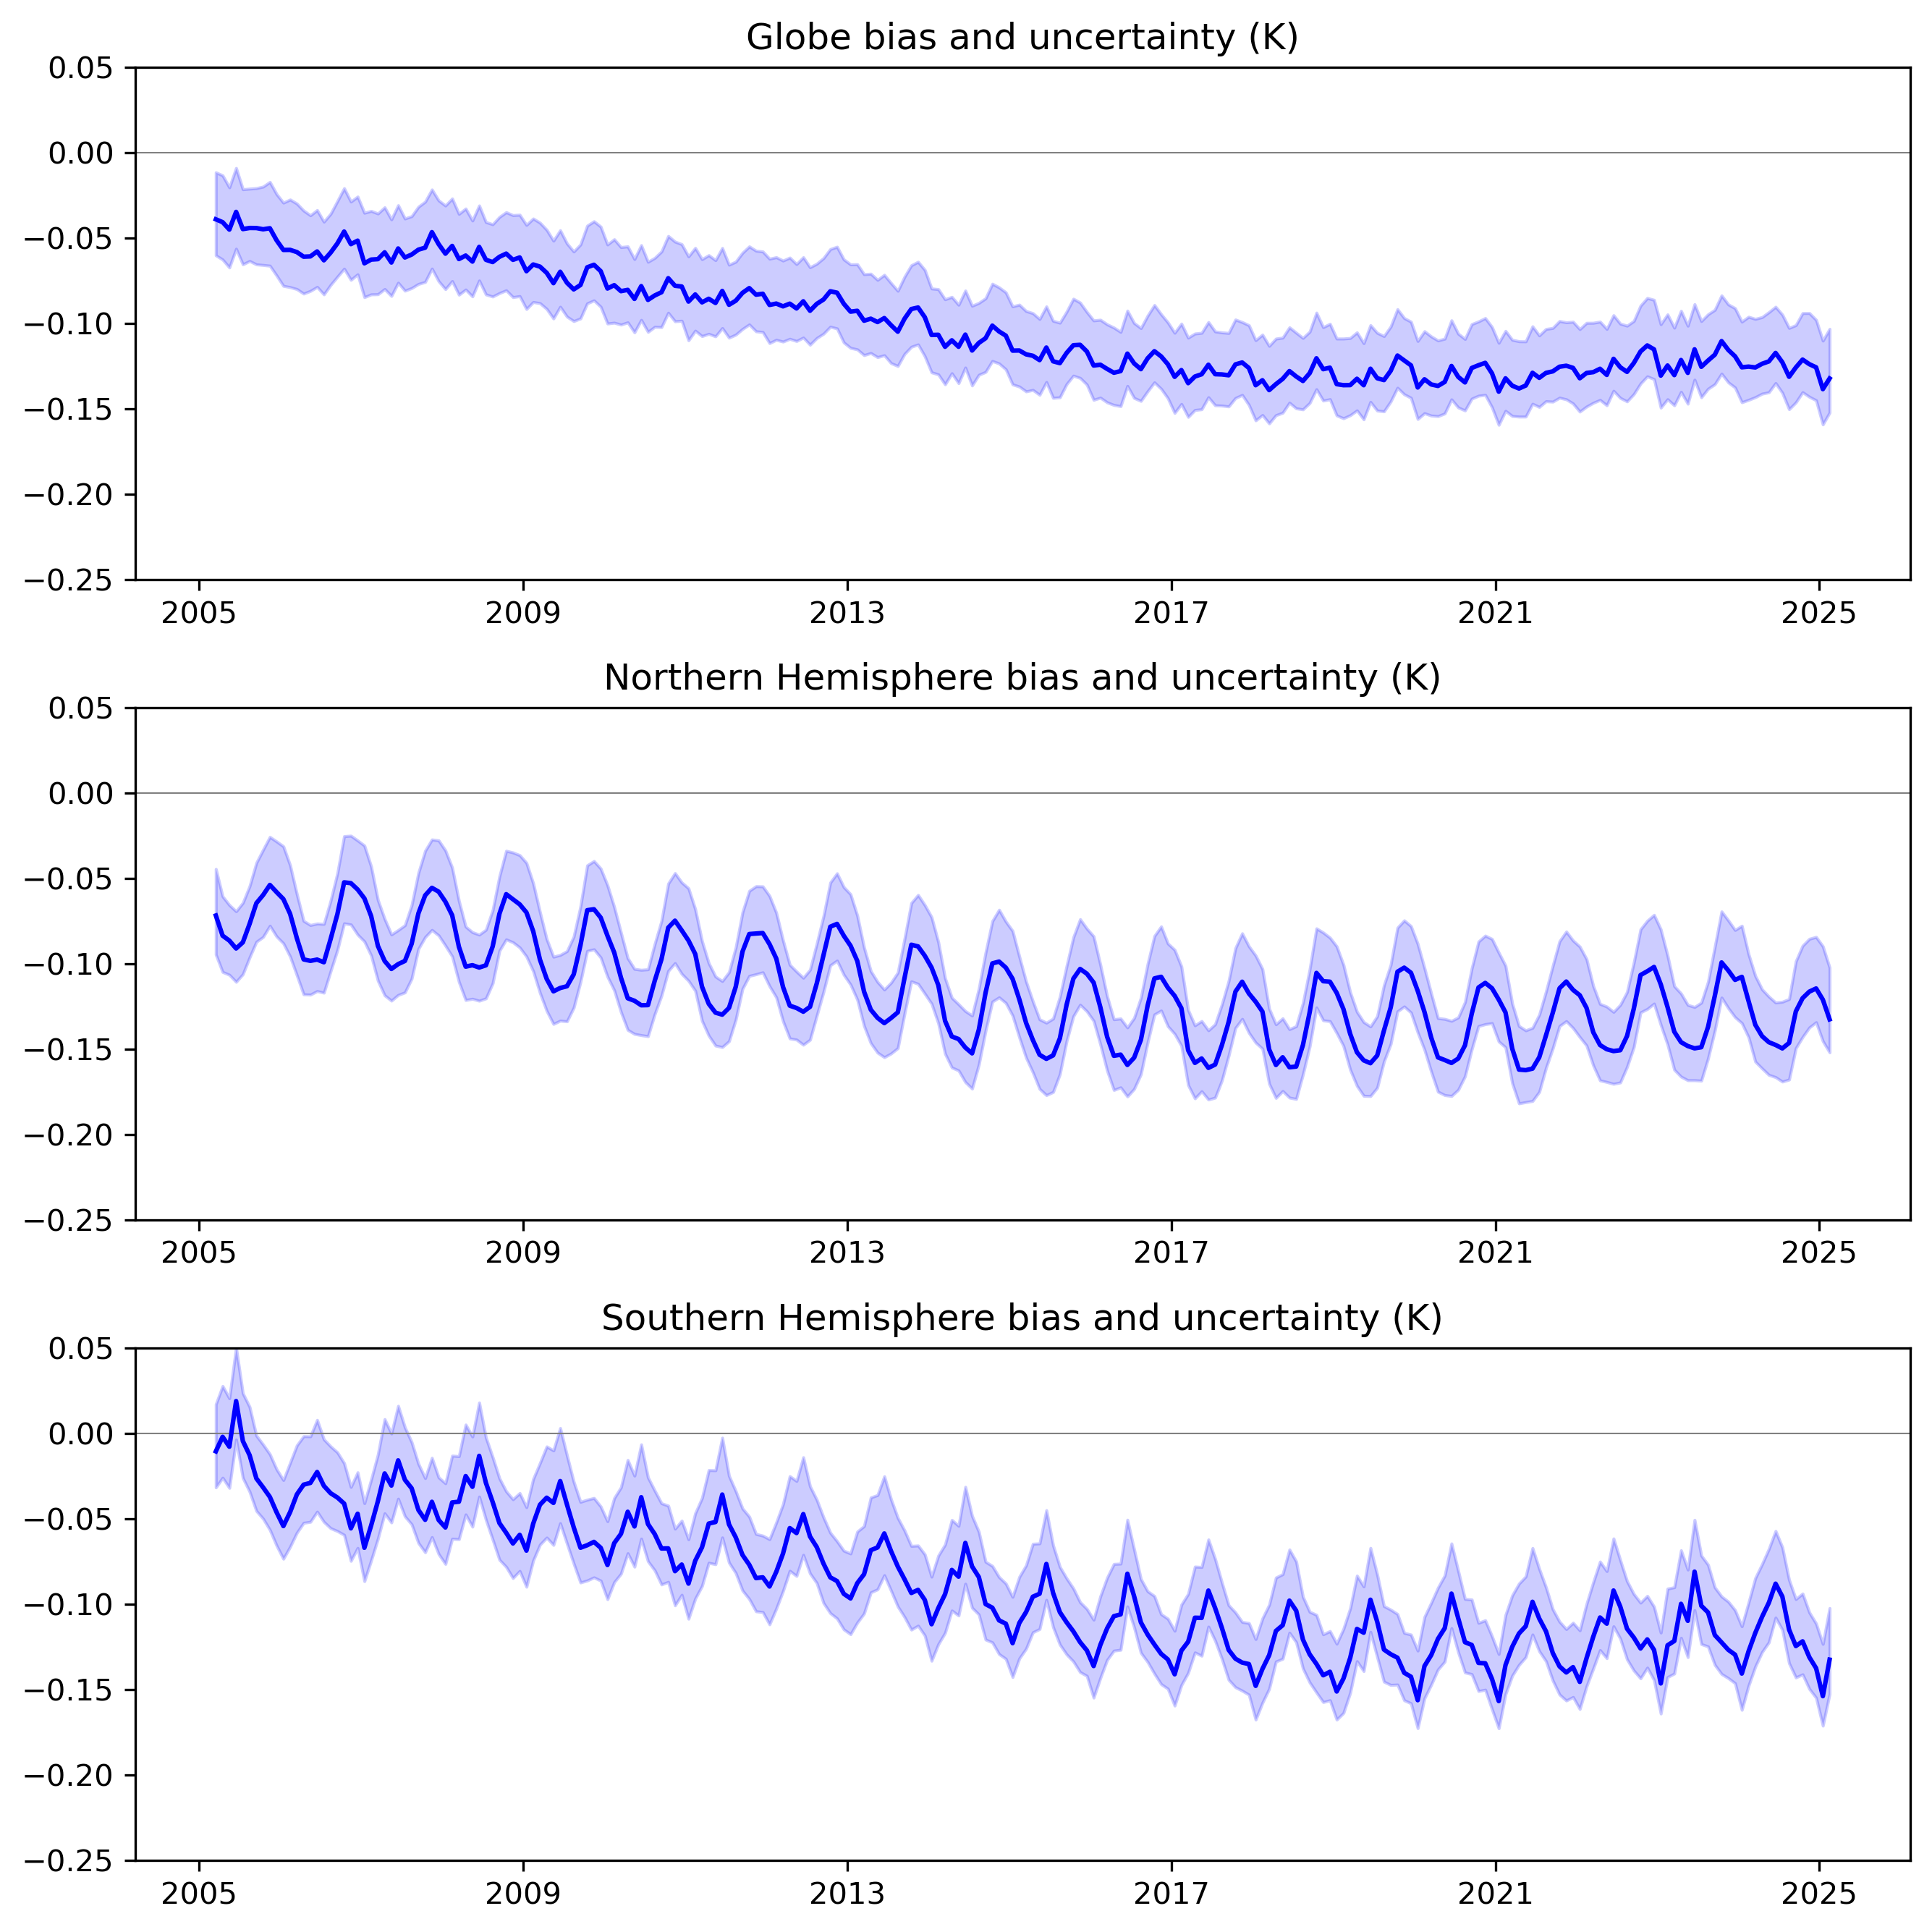
Figure 8: Estimated monthly biases in global, Northern and Southern Hemisphere average SST anomalies for the last 20 years, relative to the 1961-1990 average bias. Blue shading represents the 95% range of the 200-member bias ensemble.

Figure 9: Estimated global, Northern and Southern Hemisphere average SST anomalies for the full gridded dataset, 1850-present, relative to the 1961-1990 average. Yearly points are a simple mean of anomalies over the 12 months in each year. Blue shading represents the 95% range of the 200-member anomaly ensemble.
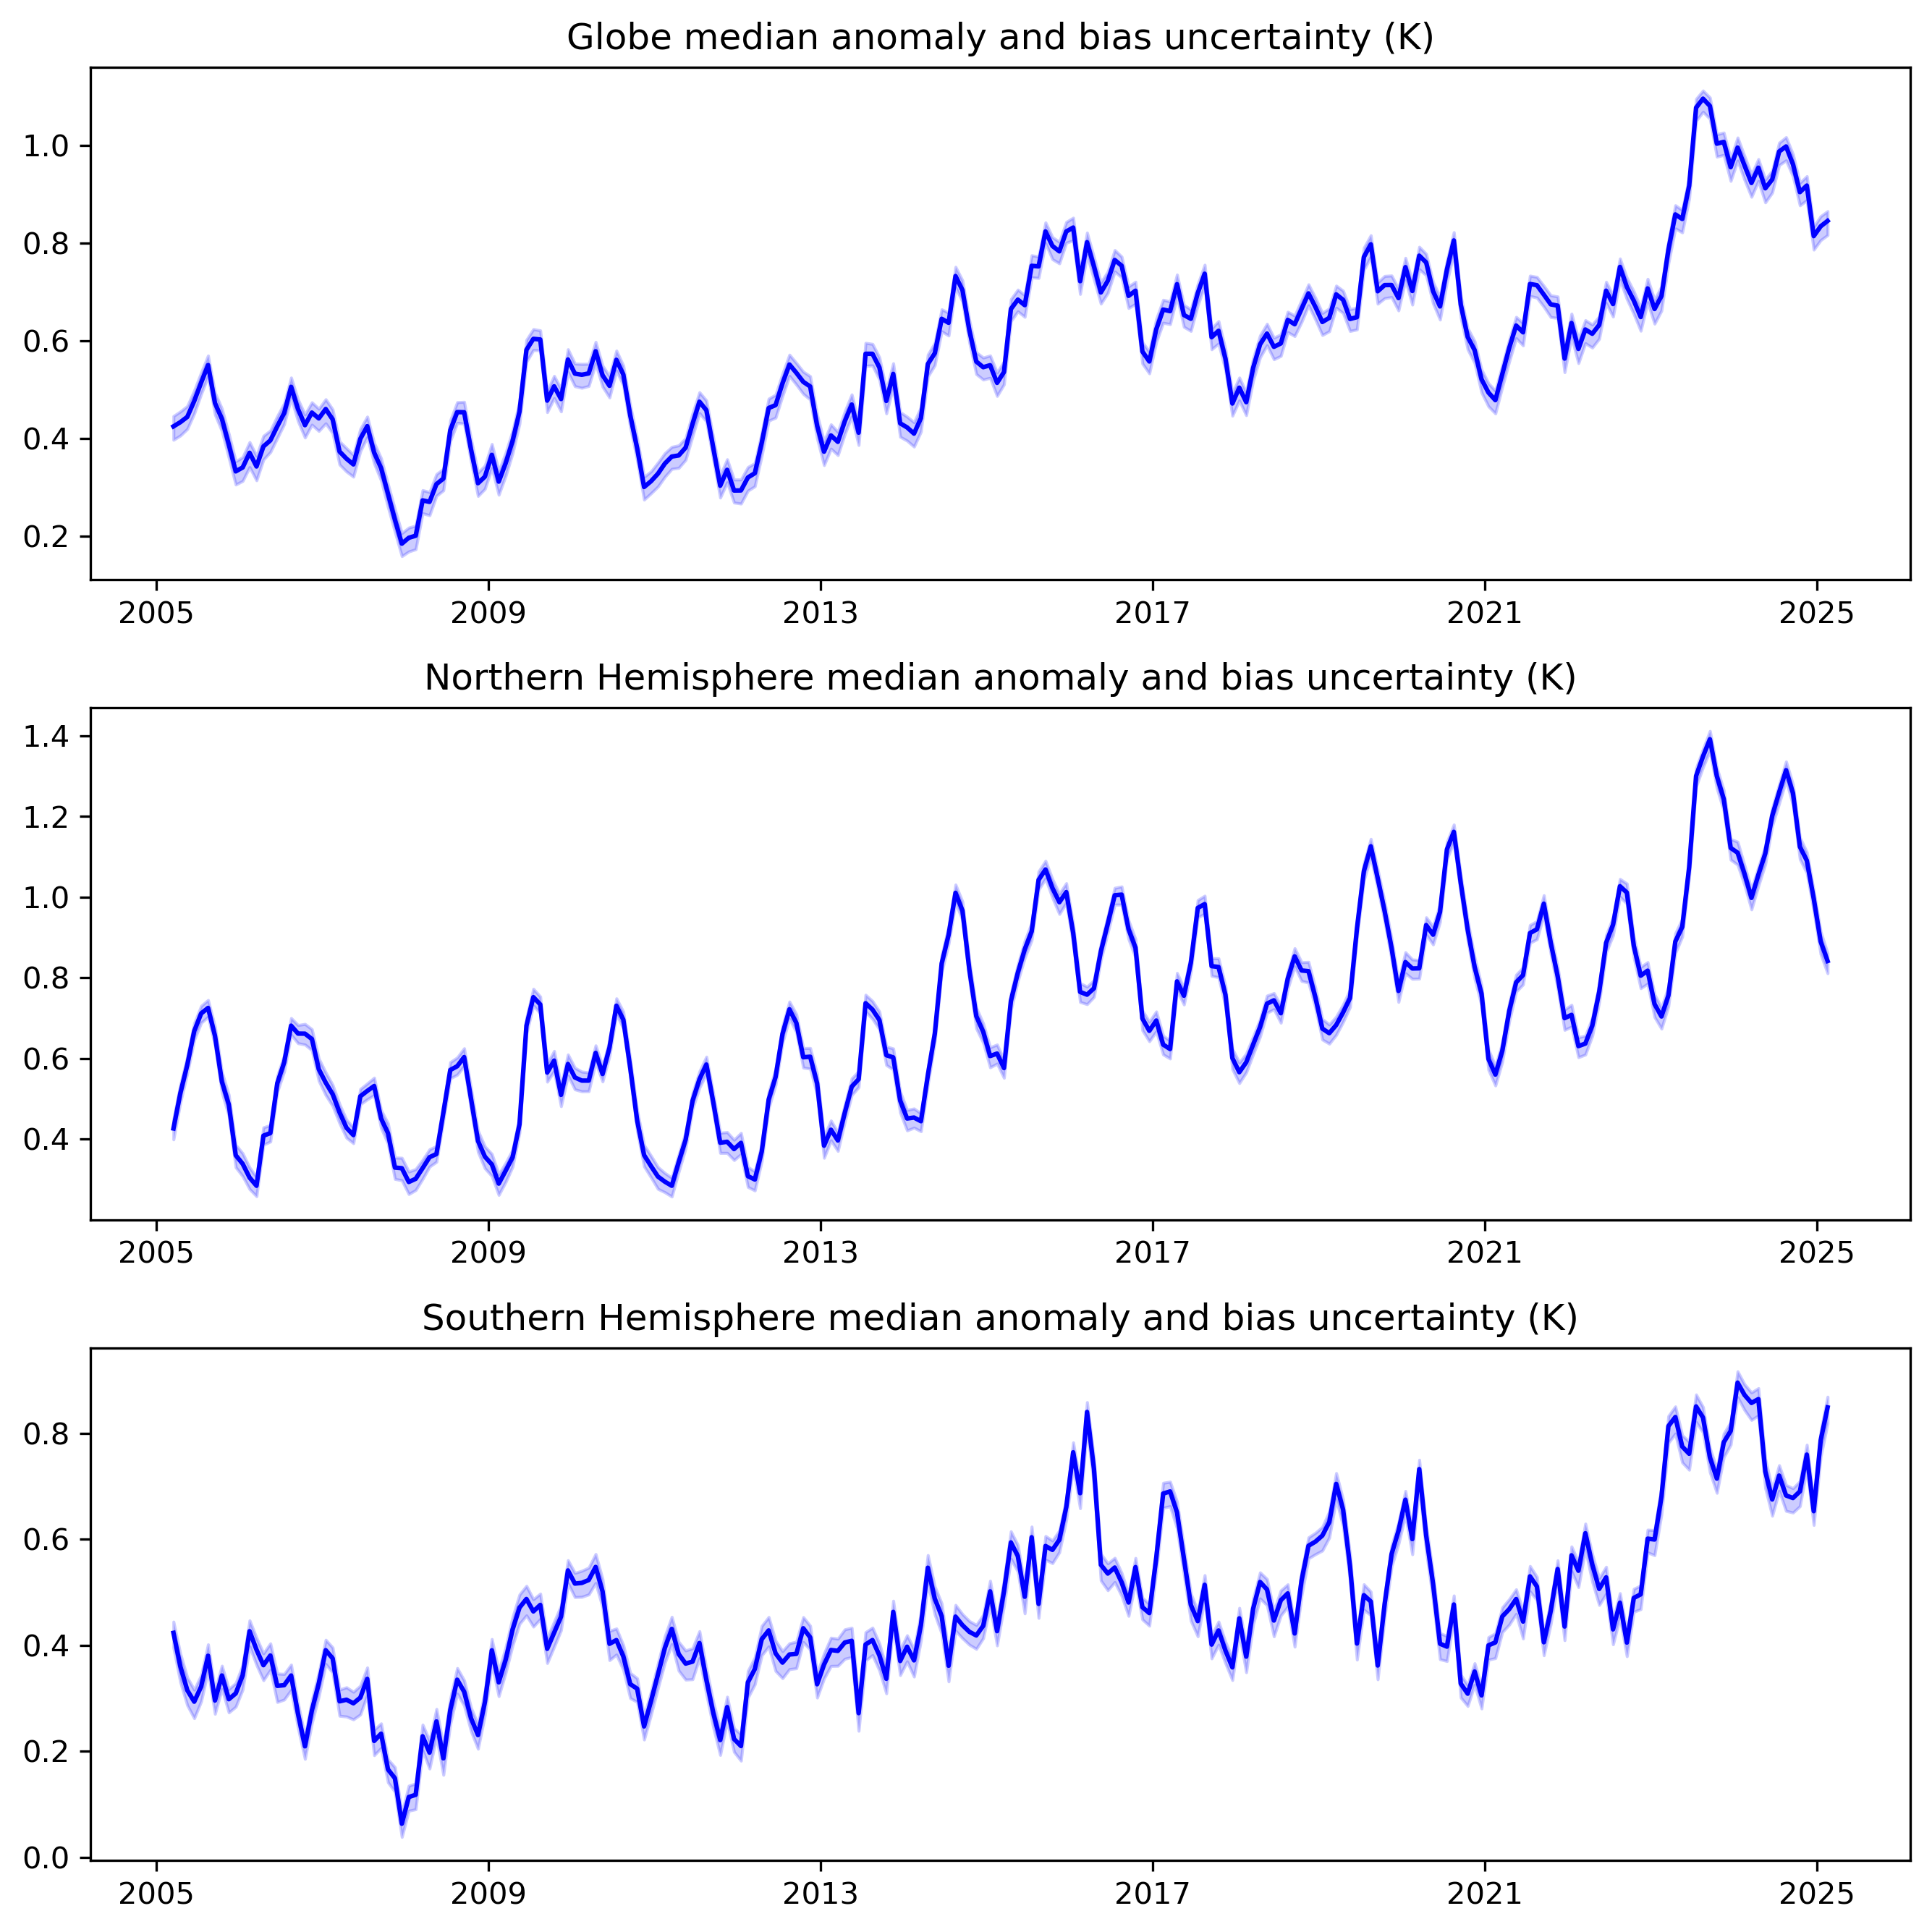
Figure 10: Estimated monthly global, Northern and Southern Hemisphere average SST anomalies for the last 20 years, relative to the 1961-1990 average. Blue shading represents the 95% range of the 200-member anomaly ensemble.
|
Maintained by: Caroline Sandford |
© Crown Copyright |