

WAFC London Performance Indicators
These plots show the performance of WAFC London forecasts produced by the Met Office in the United Kingdom.
Verification statistics for World Area Forecast Centre (WAFC) London data sets are produced by the Met Office for various regions, mostly corresponding to World Meteorological Organization (WMO) CBS-defined areas for comparison between modelling centres. Area 2 covers the north Atlantic, western Europe, and North America, with an additional area for the Middle East.
Wind and temperature plots
Wind and temperature plots for 24 hours ahead (T+24) are created using data from four daily model runs at various pressure levels. Forecasts are compared to the model’s analysis (T+0) to generate Root Mean Square (RMS) error plots. Wind errors account for direction and speed, measured in m/s, while temperature errors are in Kelvin (or degrees Celsius). Time series plots, starting from 2000 or 2001, show steady performance improvement over the years.
Download wind and temperature plots (zip file)
- Wind and temperature plots - Asia
- Wind and temperature plots - Australia/NZ
- Wind and temperature plots - Middle East
- Wind and temperature plots - North Atlantic - Area 2
- Wind and temperature plots - North Pacific
- Wind and temperature plots - Tropics
- Wind and temperature plots - Southern Hemisphere
- Wind and temperature plots - Northern Hemisphere
- Stratified wind plots - Asia and Tropics
- Stratified wind plots - Southern Hemisphere and Australia/NZ
- Stratified wind plots - Northern Hemisphere and North Atlantic
Turbulence and Cumulonimbus plots
WAFS plots for Turbulence and cumulonimbus show the performance of blended WAFC London and WAFC Washington data sets. ROC curves compare forecast hit rate, false alarm rate, miss rate, and false alarm rate. Data is available for three forecast timesteps: T+12, T+24, and T+36, over a 1-year period.
Turbulence is verified against automated aircraft observations, while Cumulonimbus Extent is verified against observed lightning and satellite imagery.
Download Cumulonimbus plots (zip file)
Download Turbulence plots (zip file)
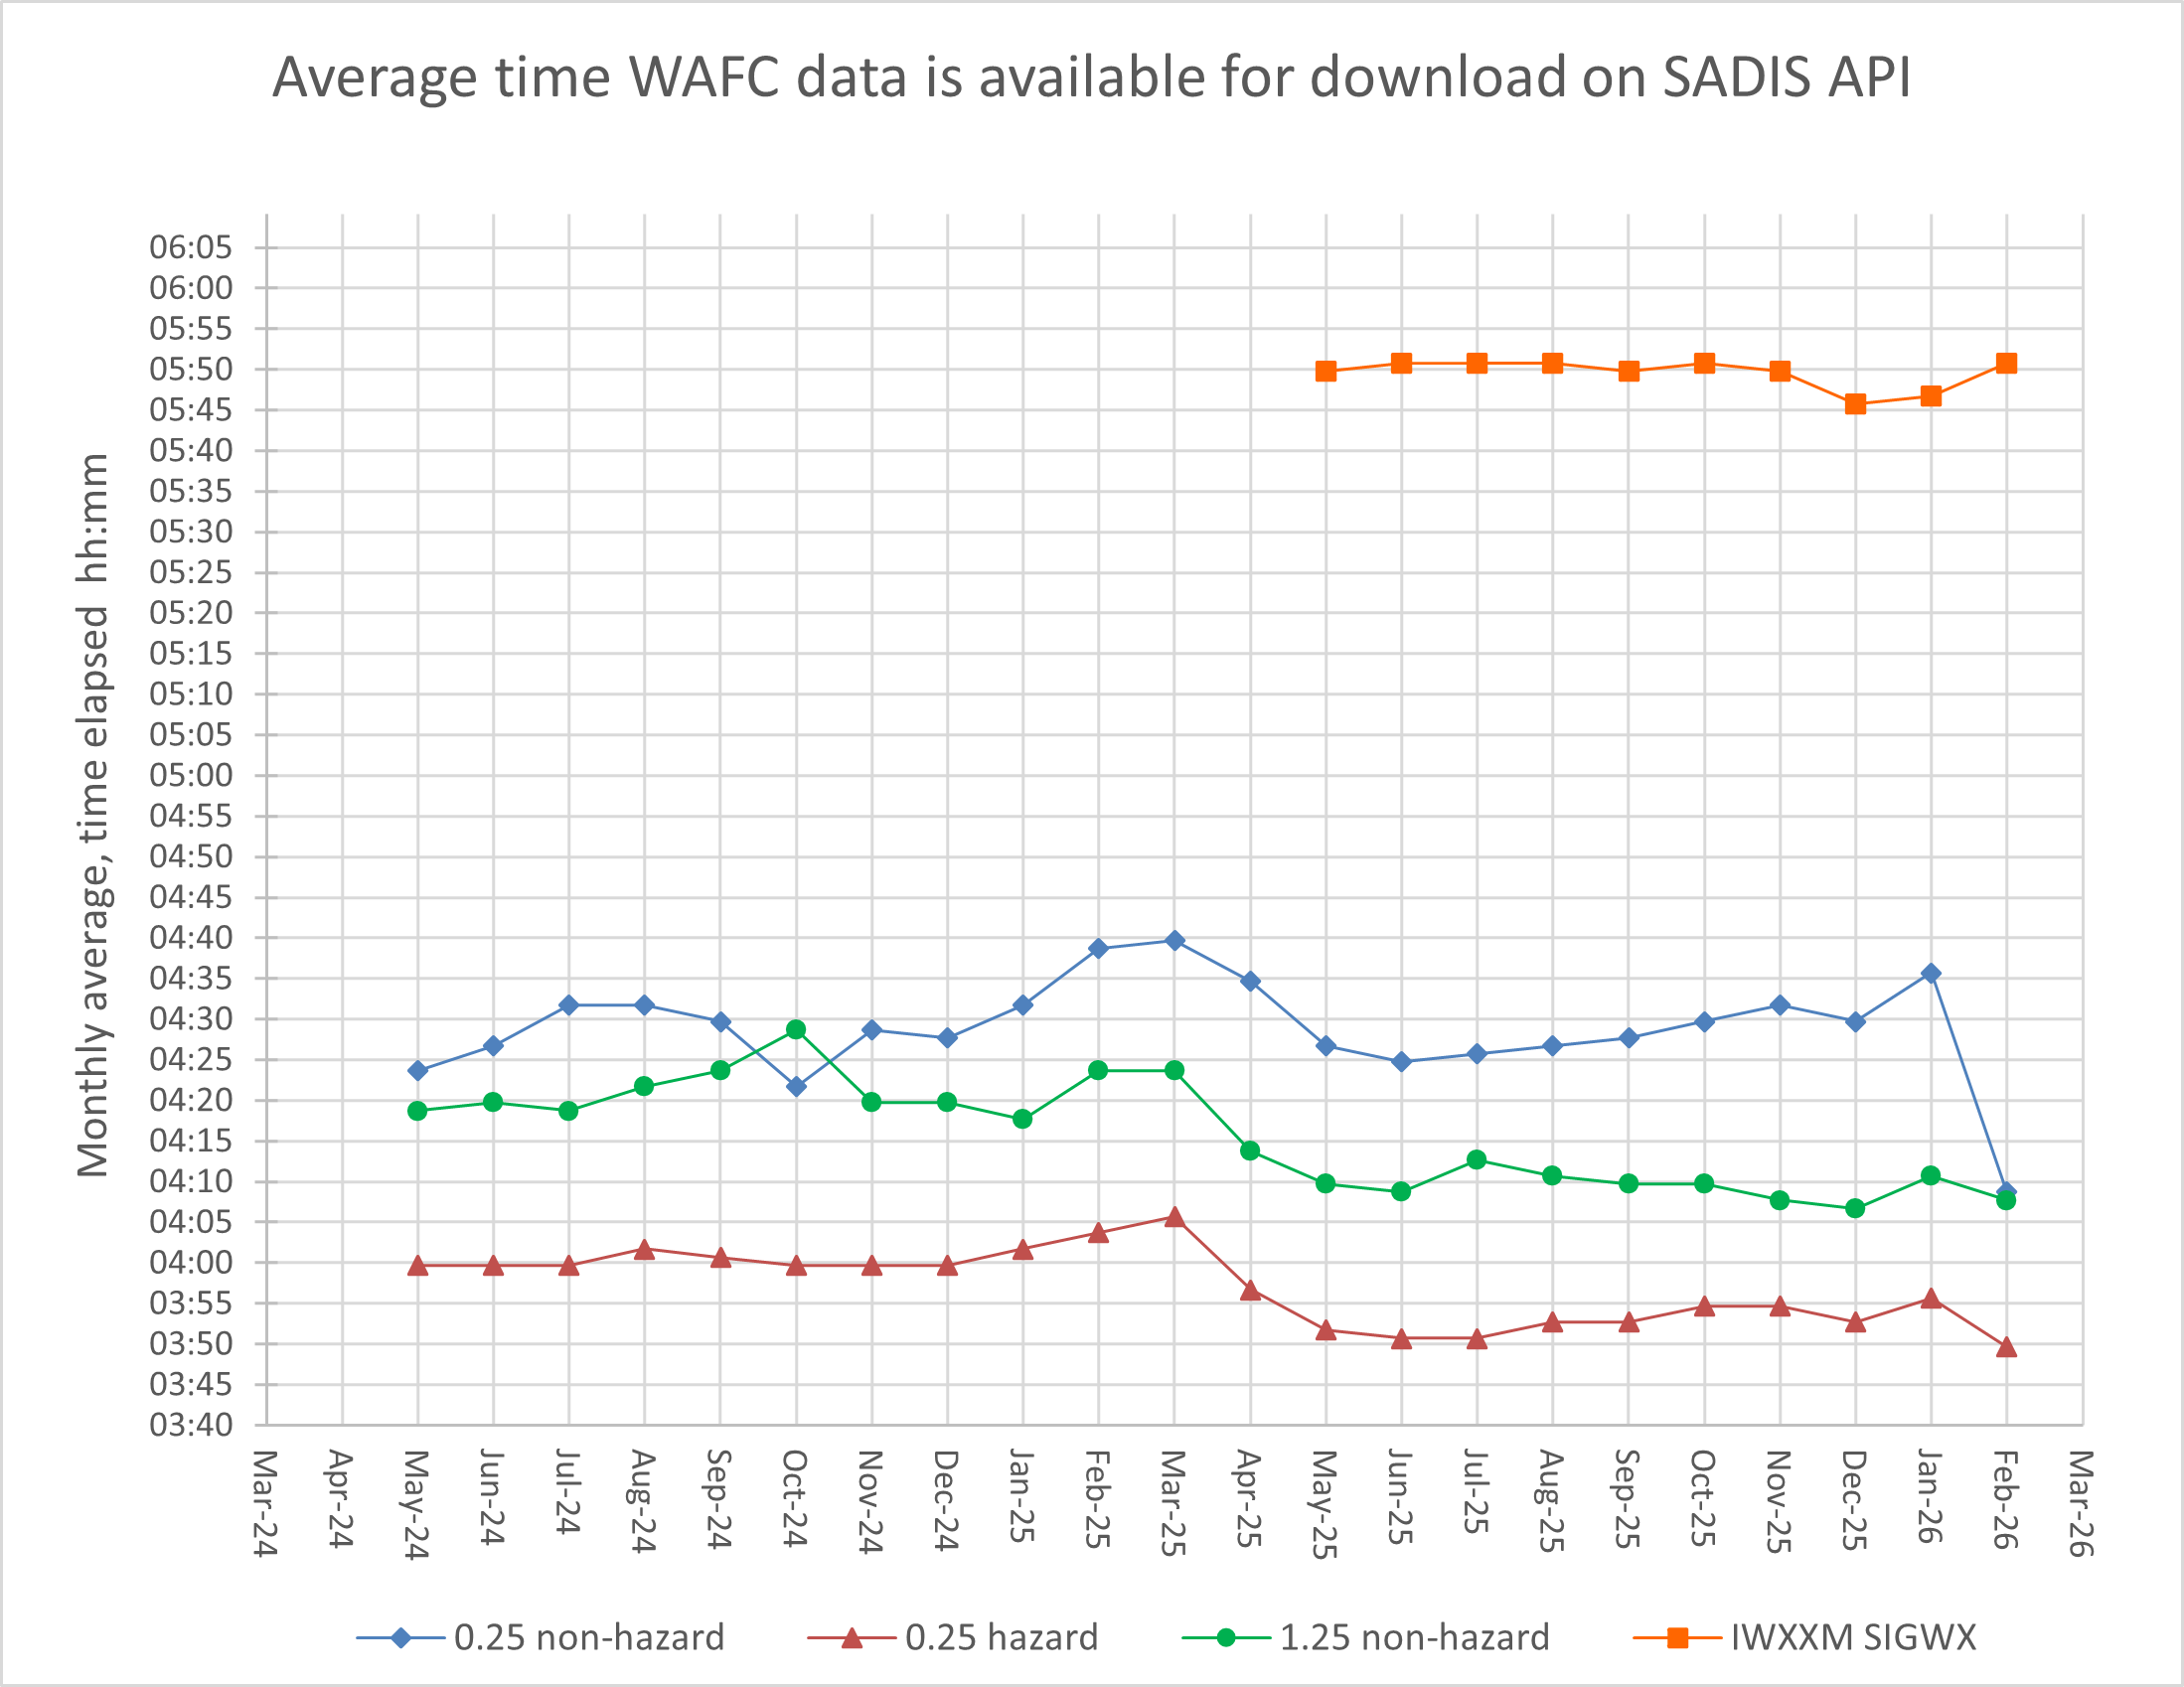
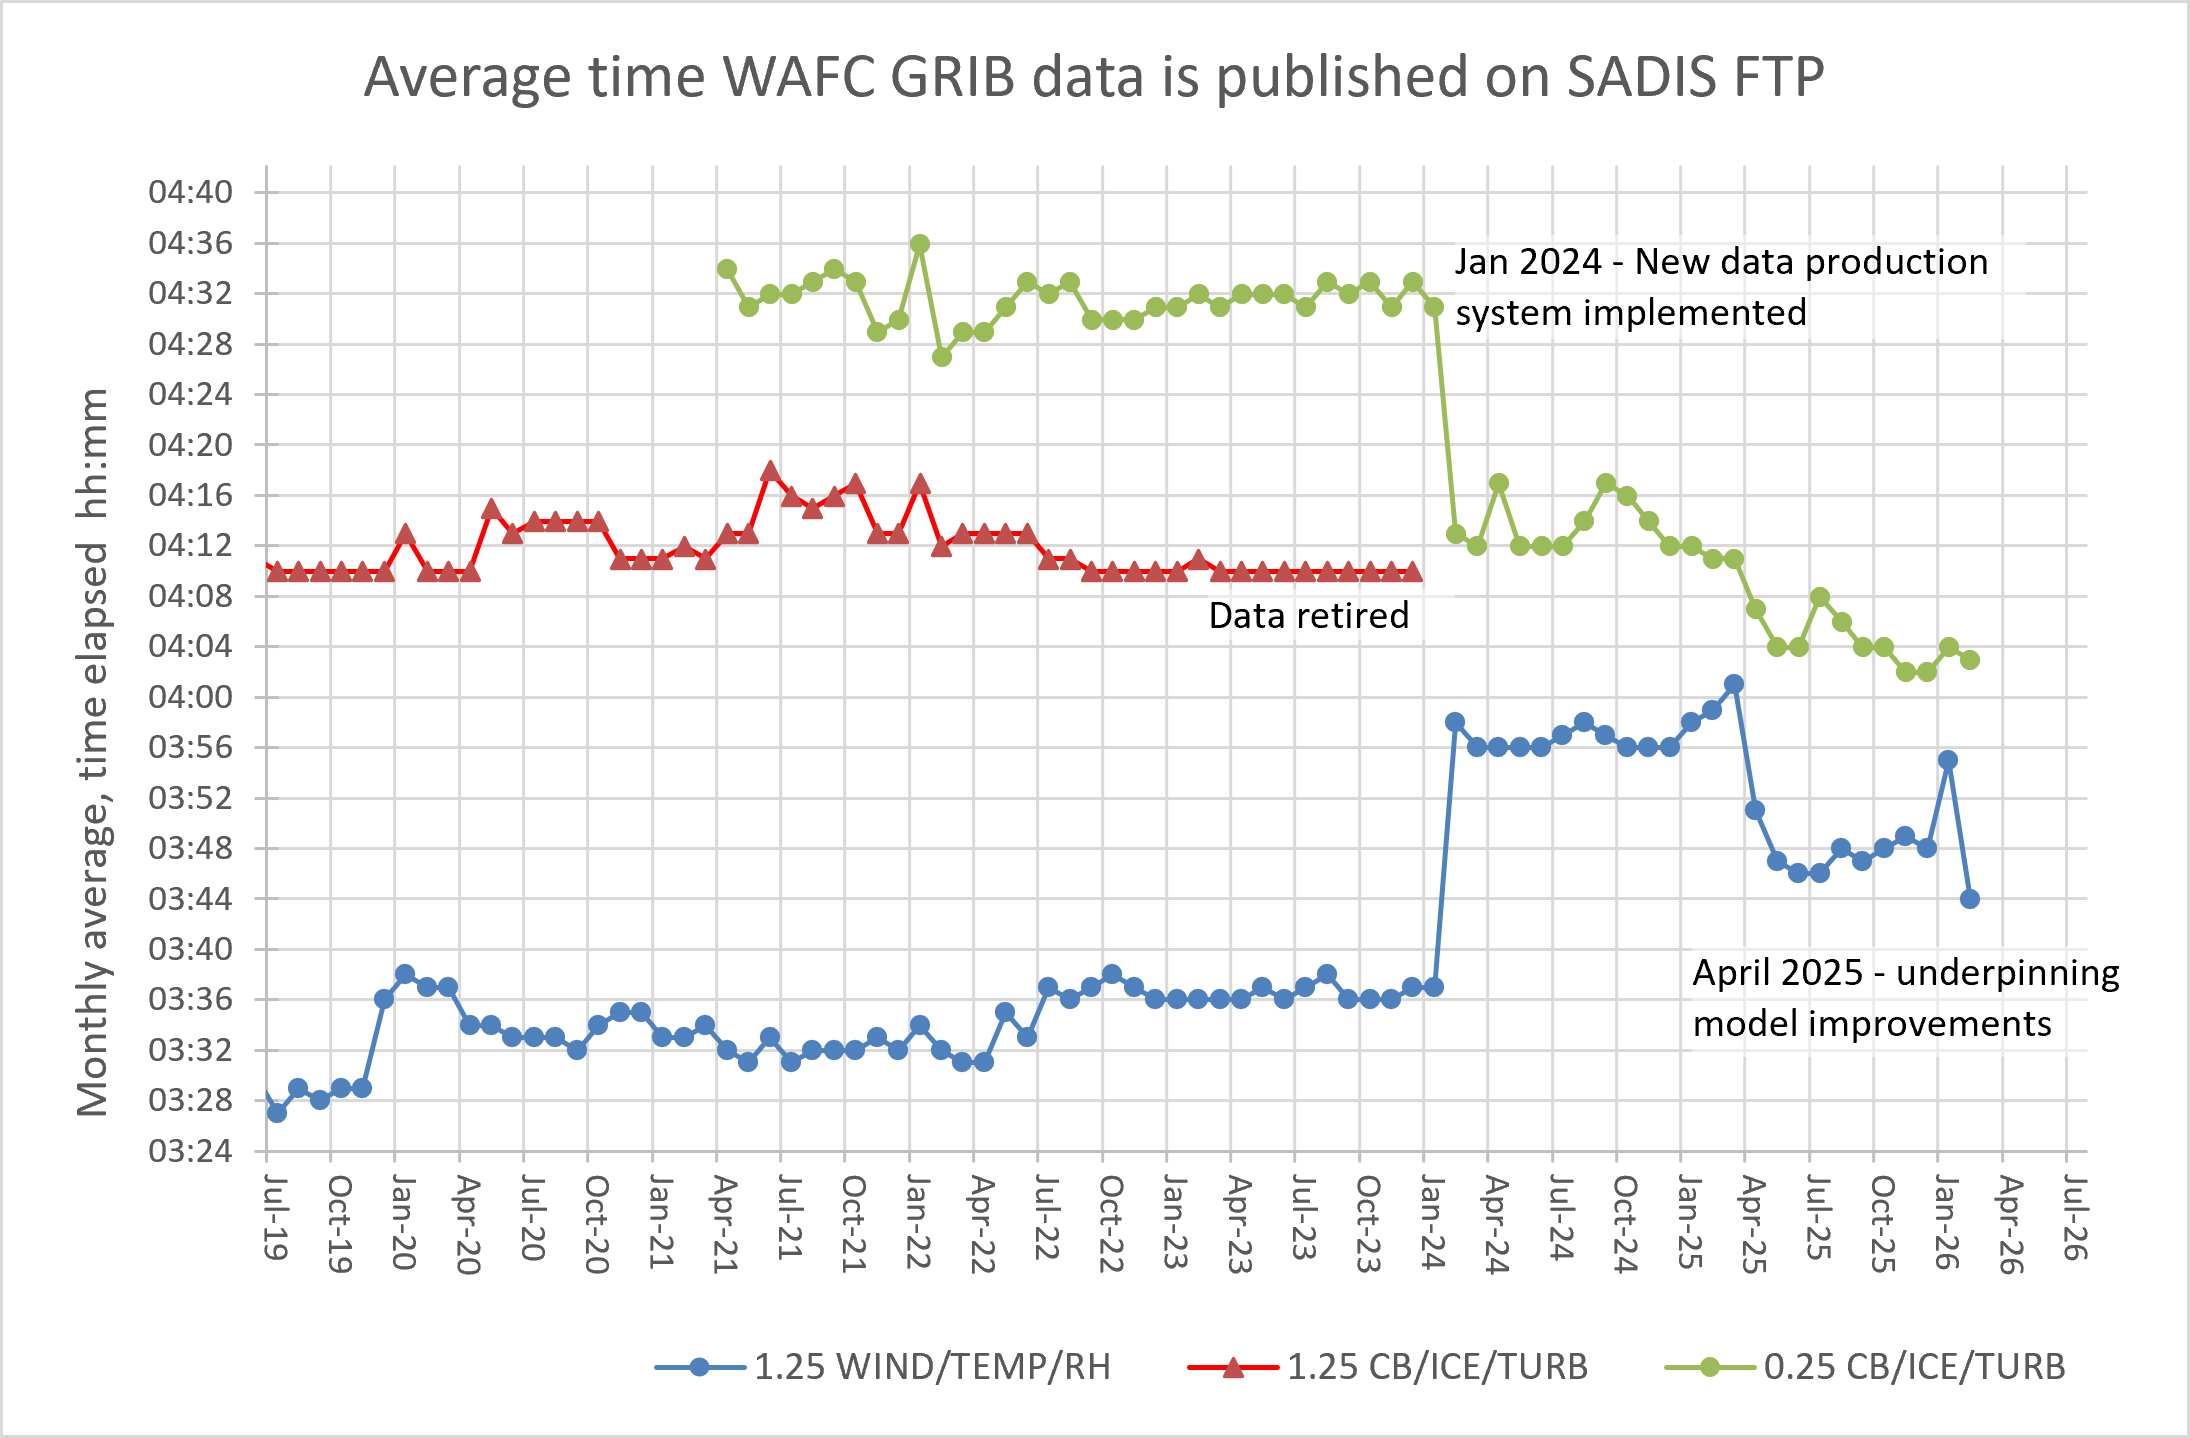
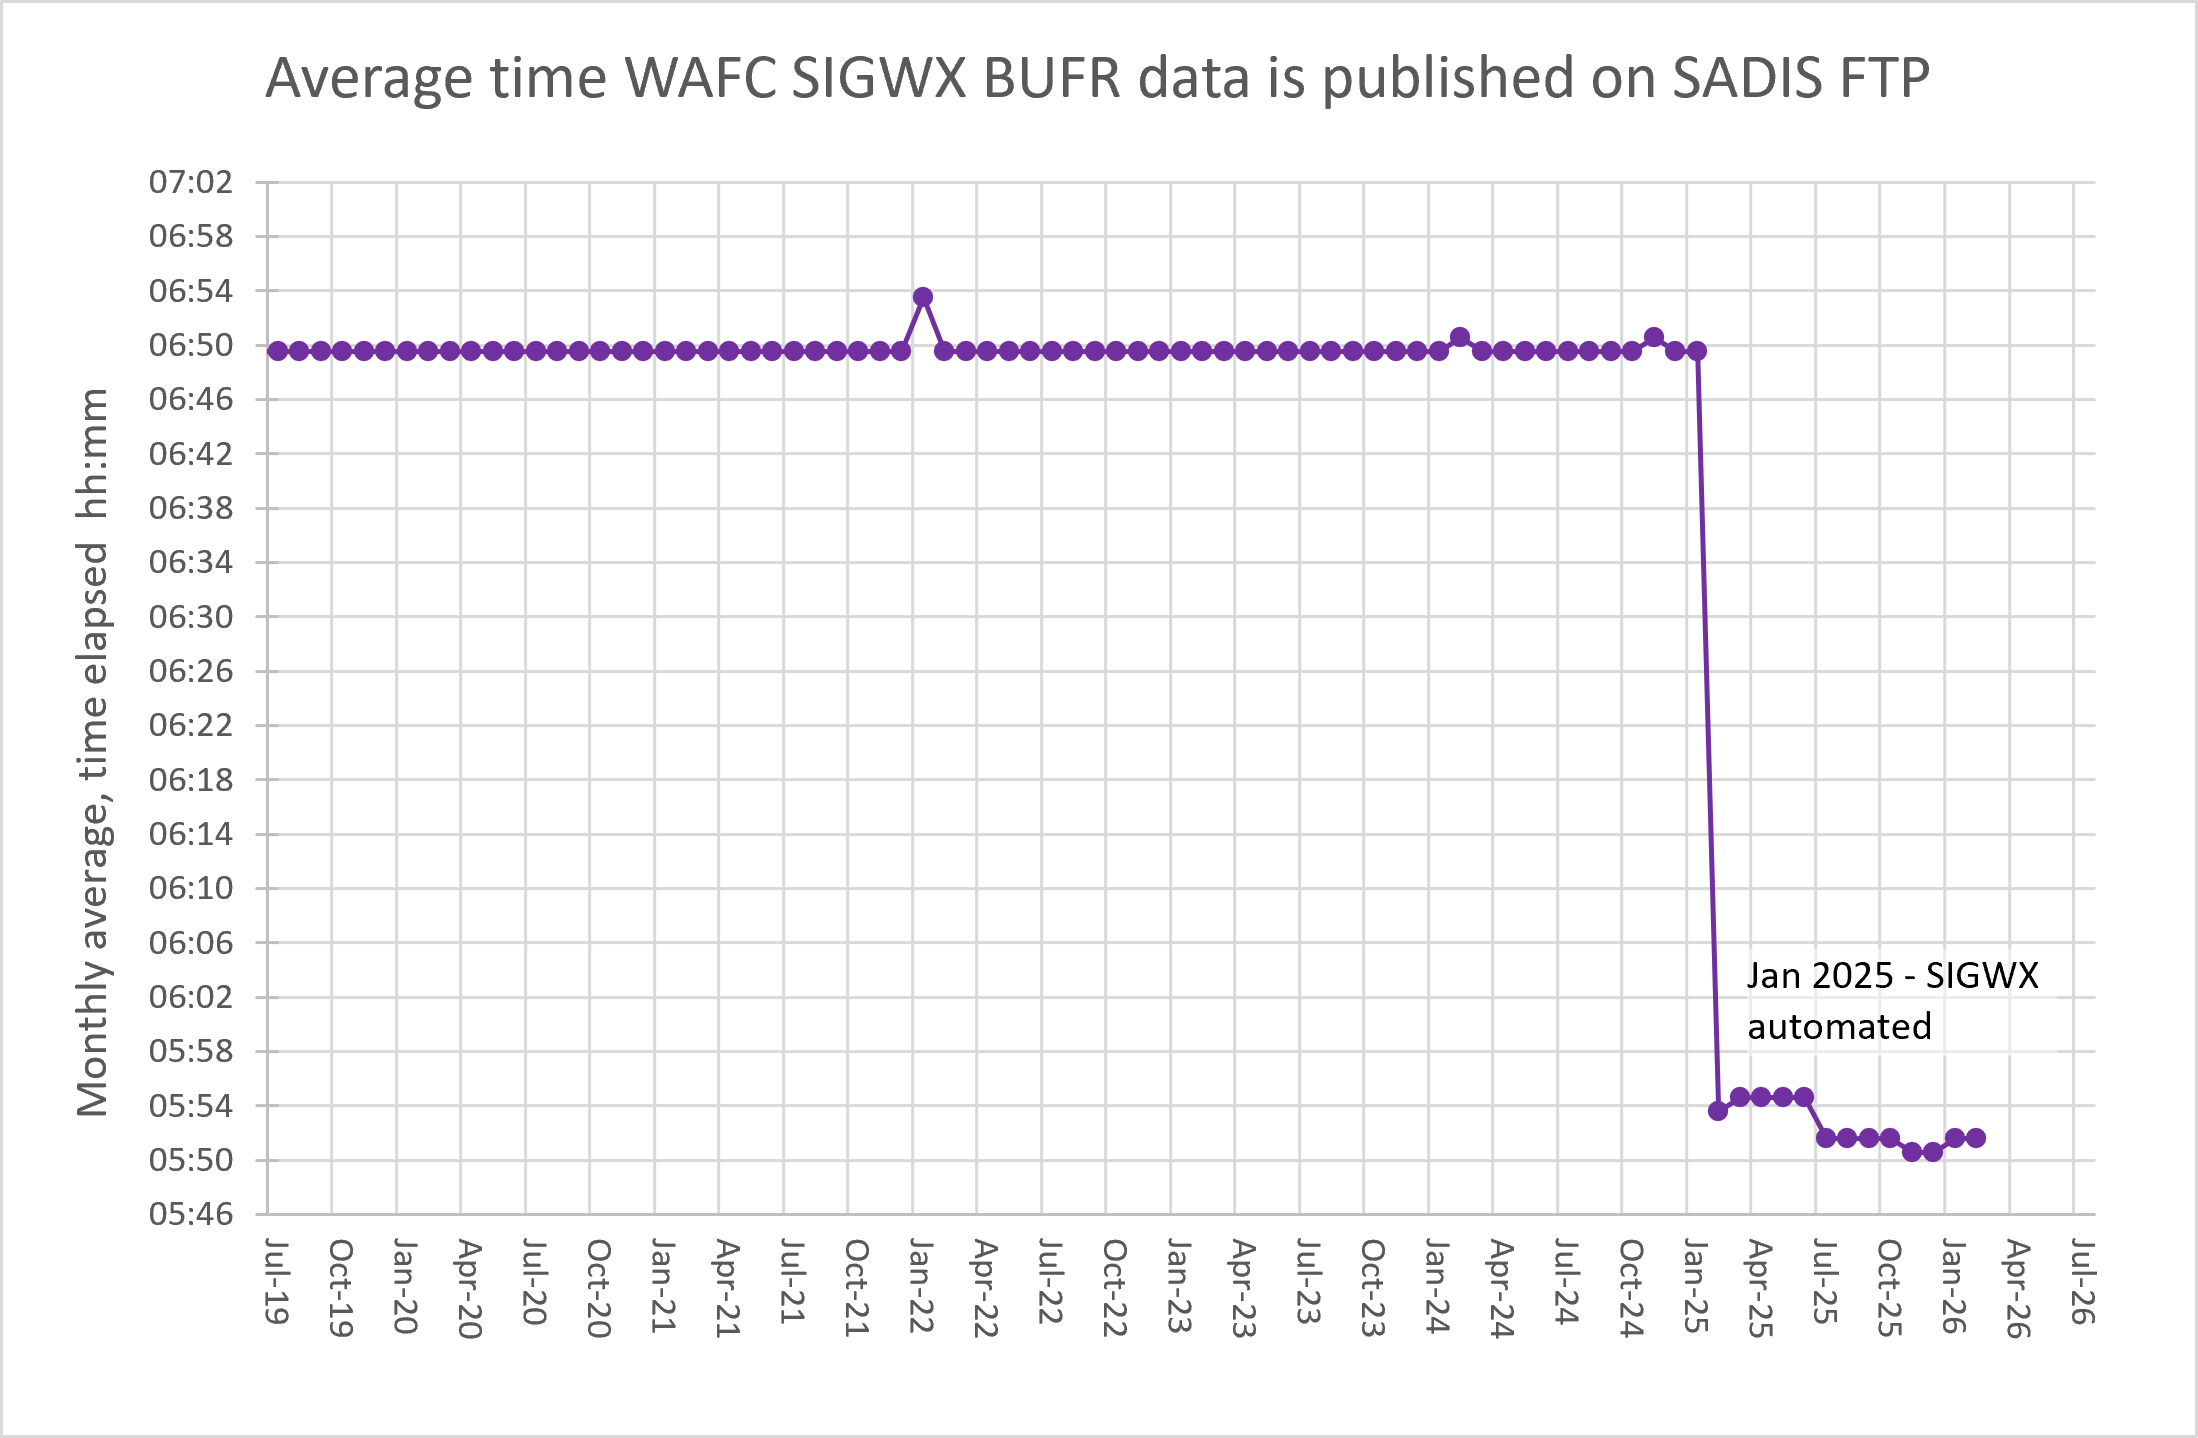
Timeliness plots
Timeliness plots show when WAFS GRIB and BUFR data is fully available on the SADIS system. Statistics are based on all four model runs, displaying elapsed time instead of actual issue time. For example, 06 UTC model GRIB hazard data is typically available at 09:35 UTC, while hazard GRIB data is available at 10:10 UTC.
GRIB
SADIS API data publish time plot
SADIS FTP gridded publish time plot
BUFR
SADIS FTP SIGWX publish time plot
Get in touch
Call us
We are available 24/7.
0370 900 0100Email us
Fill out this short form and we'll get back to you.
Contact Us formFollow us
Linkedin XGet in touch
Call us
We are available 24/7.
0370 900 0100Email us
Fill out this short form and we'll get back to you.
Contact Us form